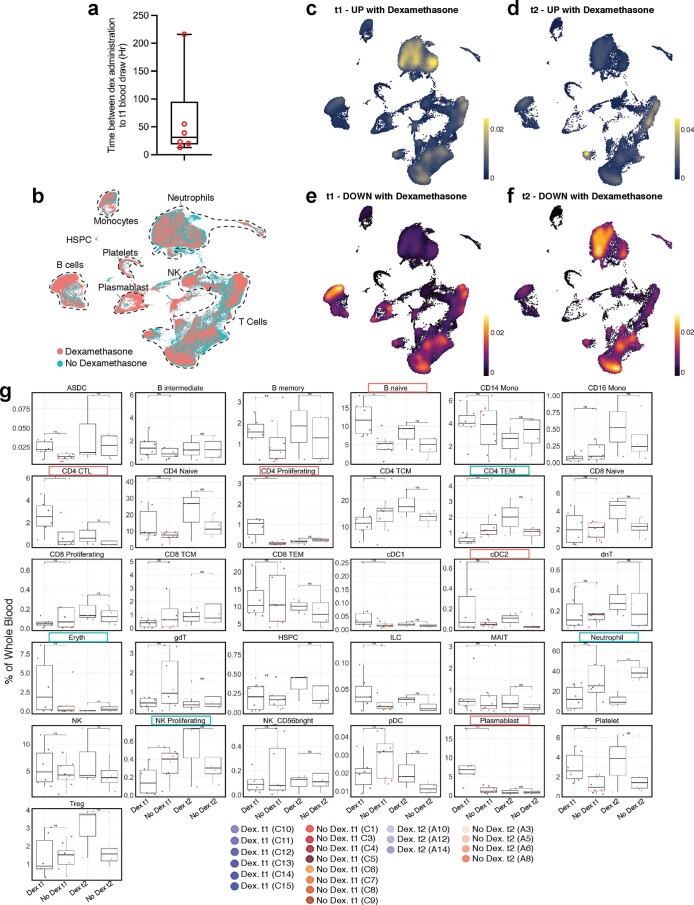
Extended Data Fig. 5. Immunosuppressive effects of dexamethasone are mediated through neutrophils and multiple adaptive immune cell subsets.
a. Bar plot shows distribution of time interval (in hours) between dexamethasone administration to first blood draw at t1. Box plot include a line across the box, upper hinge, and lower hinge which represent median, Q3, Q1, respectively. The lower and upper hinges correspond to the Q1 and Q3. The upper whisker extends from the hinge to the largest value no further than Q3 + 1.5× interquartile range (IQR). The lower whisker extends from the hinge to the smallest value at most Q1 – 1.5 * IQR. b. UMAP projection of 80,994 whole blood cells from 21 patient samples, coloured by treatment groups (non-dexamethasone COVID-19 ARDS (n = 8 at t1, n = 4 at t2; dexamethasone-treated COVID-19 ARDS (n = 6 at t1, n = 3 at t2)) c-f. Kernel density estimates depicting magnitude of response elicited by immune cell subsets following dexamethasone treatment at 72 hours post-ICU (c-d) and 7 days post-ICU (e-f) calculated by summing consensus DEG fold changes for each cell subset shown in Panel B. Consensus DEGs upregulated following dexamethasone treatment are plotted on cividis spectrum whereas downregulated DEGs are plotted on inferno spectrum. g. Boxplots showing percentage of each cell type in each patient sample grouped by treatment and coloured by donor ID. The x axes correspond to four treatment groups. n = 6, n = 8, n = 3, and n = 4 biologically independent samples from dexamethasone-treated t1, no dexamethasone t1, dexamethasone-treated t2, no dexamethasone t2, respectively. Significance of effects was estimated using two-sided generalized linear mixed-effects model (glmer, binomial distribution) with fixed (dexamethasone vs no dexamethasone) and random (per patient) effects. P-values were calculated using likelihood-ratio chi-square for generalized linear models (using R package ‘car’) and were adjusted for multiple comparisons using Bonferroni correction. All effects with p < 0.05 are indicated. *p < 0.05, **p < 0.01, ***p < 0.001. Absolute p-adjusted values are provided in Supplementary Table 8.

