
Figure 1.
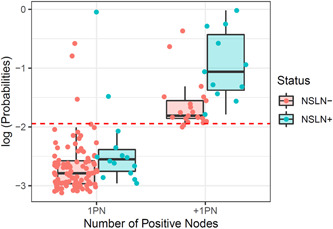
Output (log) probabilities from the Bertolli et al. model for patients with metastases in NSLN (NSLN+) and without metastases in NSLN (NSLN−). The dashed line indicates the probability threshold recommended by the authors to discriminate between high‐risk and low‐risk patients. This threshold is similar to dividing the patients according to whether they have a single positive node (1PN) or more than one (+1PN)