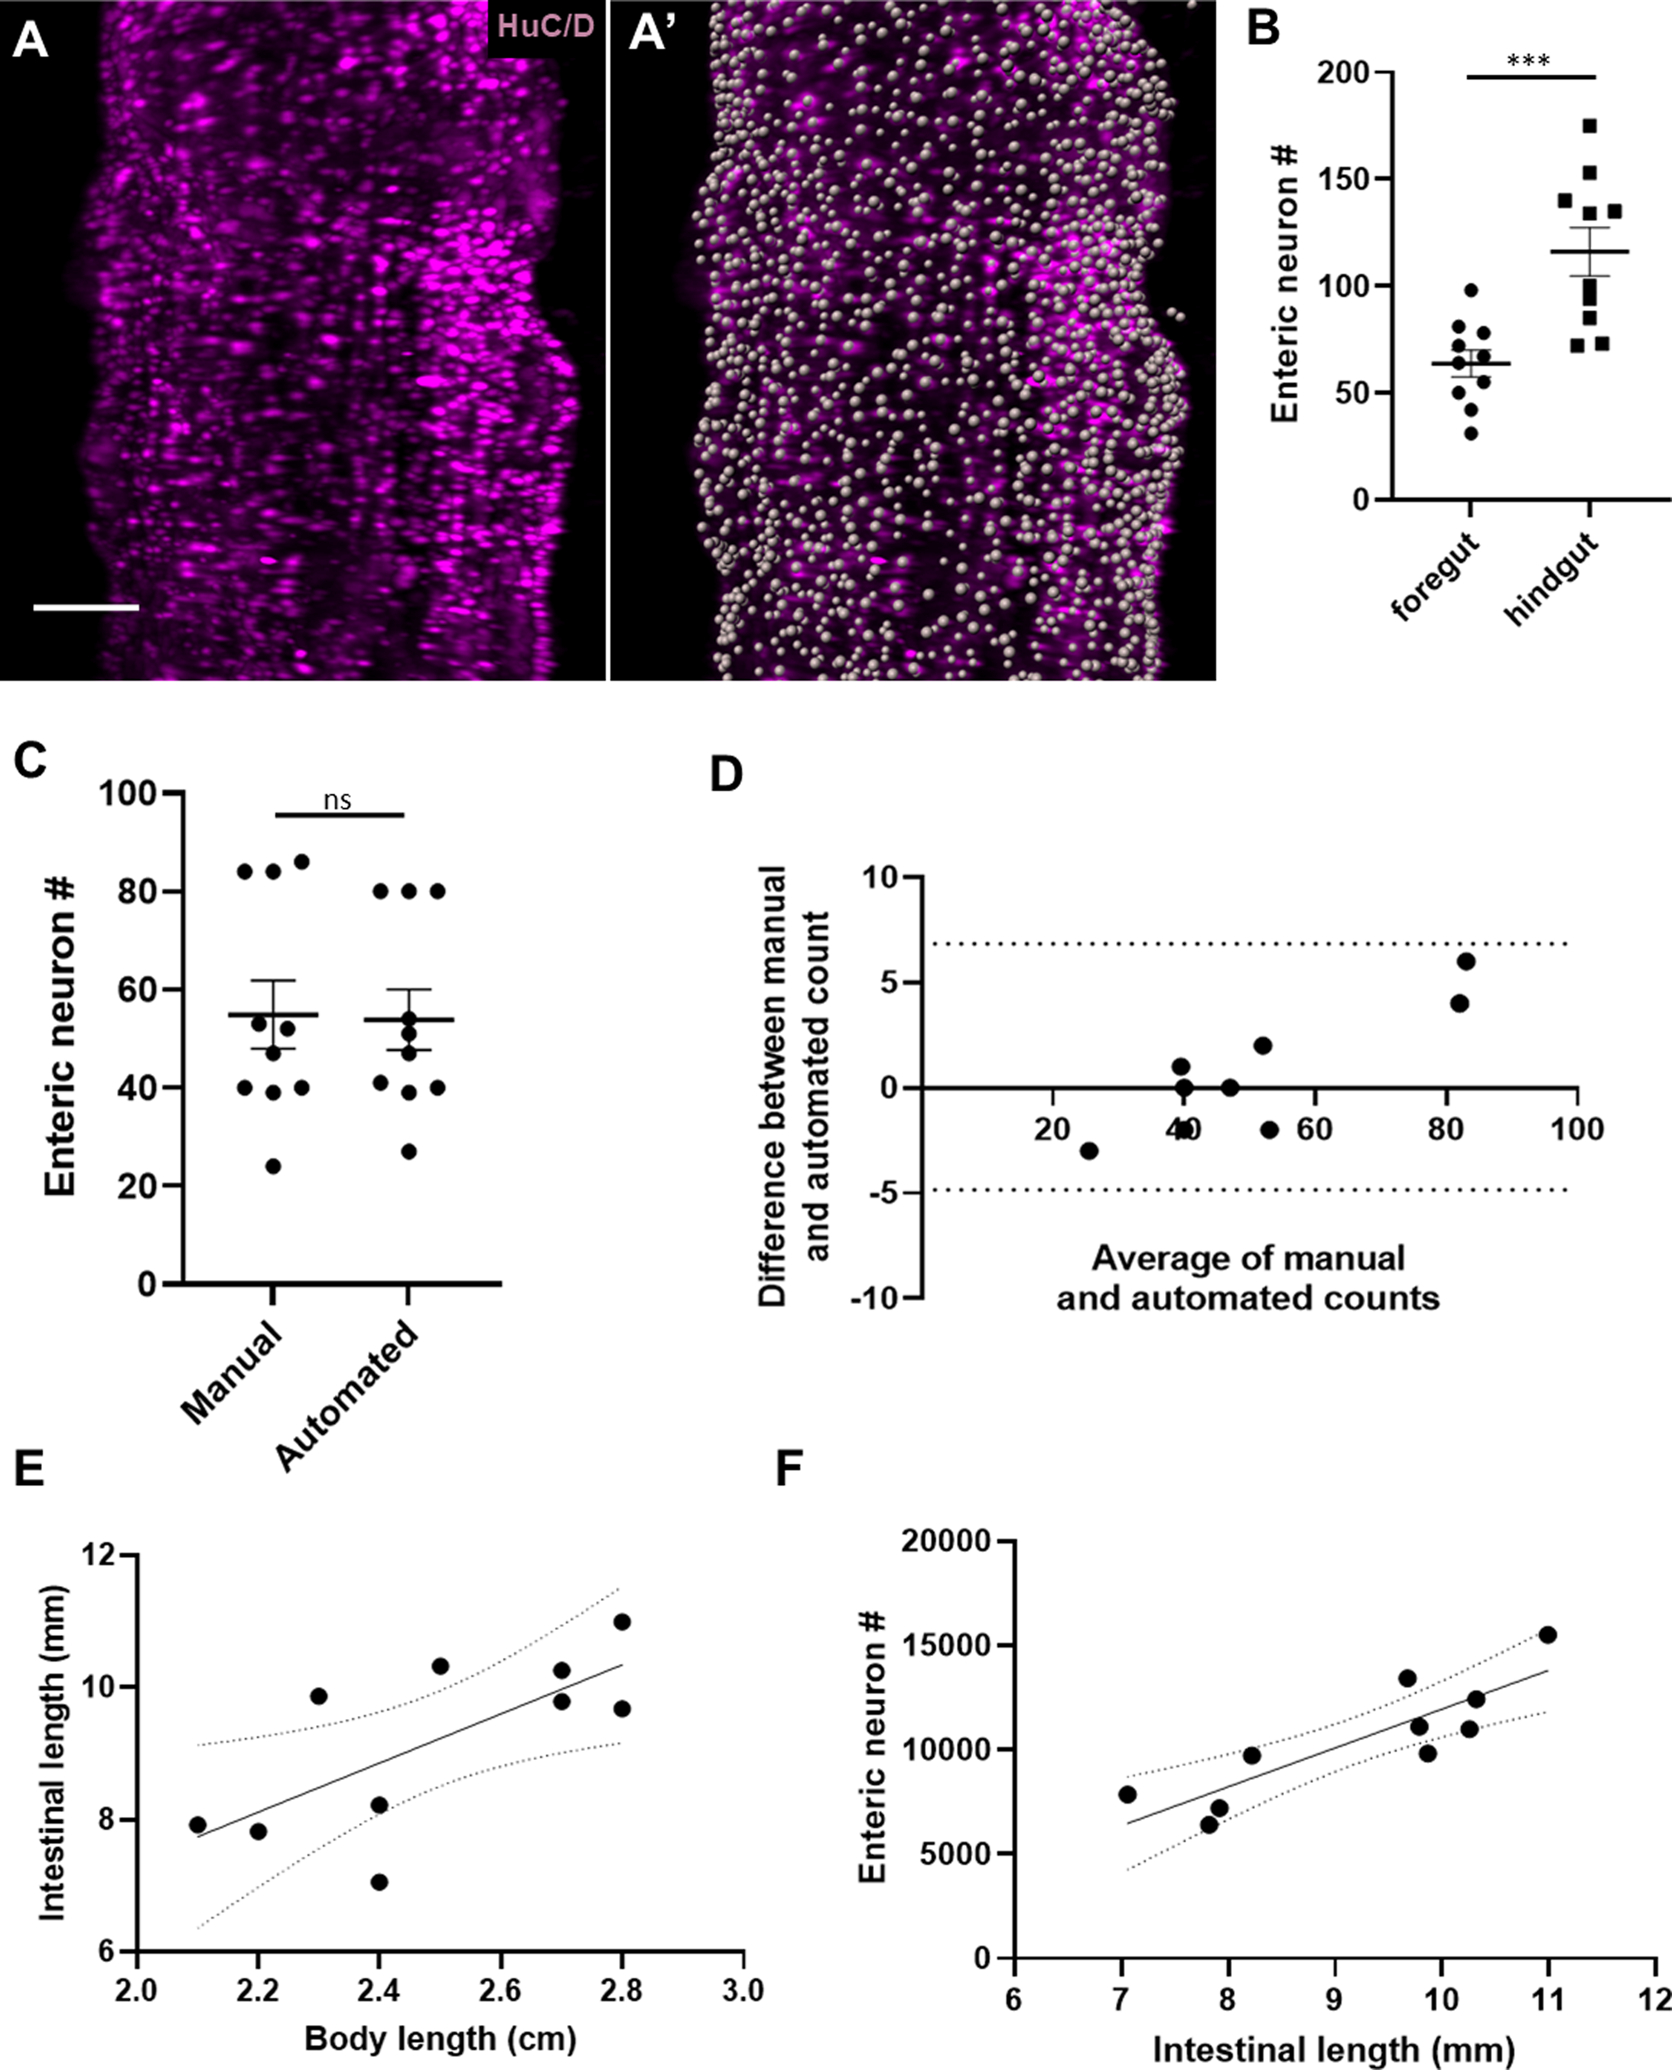
Figure 2: Whole gut imaging with immunostaining versus HuC/D reveals varied density of neurons within the intestine and proportional increase of total neuron number relative to intestinal length.

2A) Representative image of a segment of hindgut immunostained for HuC/D before (A) and after (A’) automated cell counting.
2B) Cell counts within 300 μm2 revealed significantly higher densities of neurons in the distal hindgut versus the proximal foregut (116.1 vs 63.80, p=0.0008).
2C and 2D) Manual and automated cell counts within 300 μm2 sample regions (N=10) were not significantly different by T test analysis (p=0.9156) [Fig. 2C]. Agreement between automated and manual counts was further supported by Bland-Altman analysis, with all measurements falling within the 95% limits of agreement (dotted lines) [Fig. 2D].
2E) A linear regression analysis of intestinal length vs body length (R2 = 0.50, p = 0.022), with dotted lines representing the 95% confidence interval.
2F) A linear regression analysis of enteric neuron number versus intestinal length (R2 = 0.74, p = 0.0014), with dotted lines representing the 95% confidence interval.
Scale bar 100um
