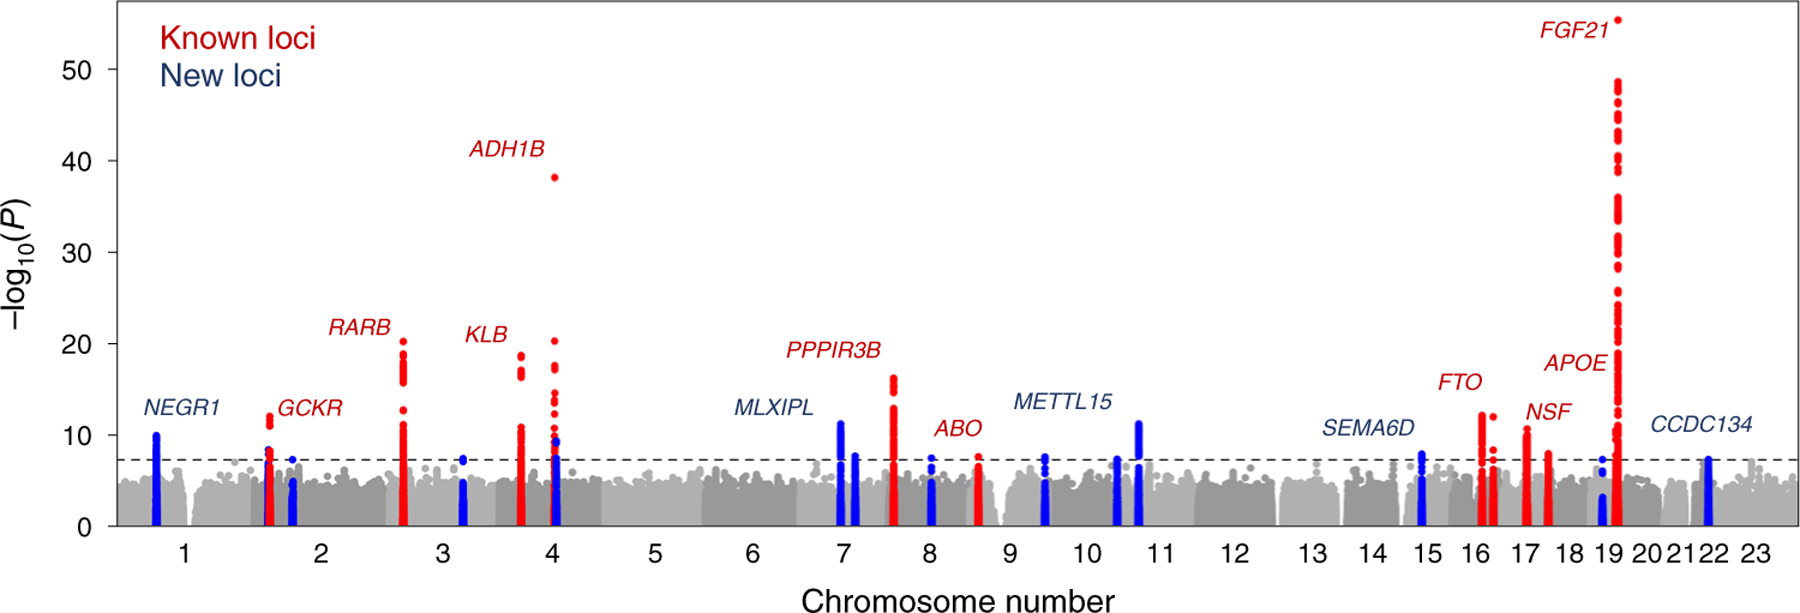
Fig. 1 |. SNP-based association with overall variation in dietary intake in the multivariate genome-wide analysis of 282,271 individuals from CHARGe and the UKBB.

Manhattan plot showing the −log10 P values (y axis) for all genotyped and imputed SNPs that passed quality control in each GWAS, plotted by chromosome (x axis). The horizontal line denotes genome-wide significance (P = 5 × 10⁻⁸). The red labelling denotes previously identified variants and the blue labelling new variants.
