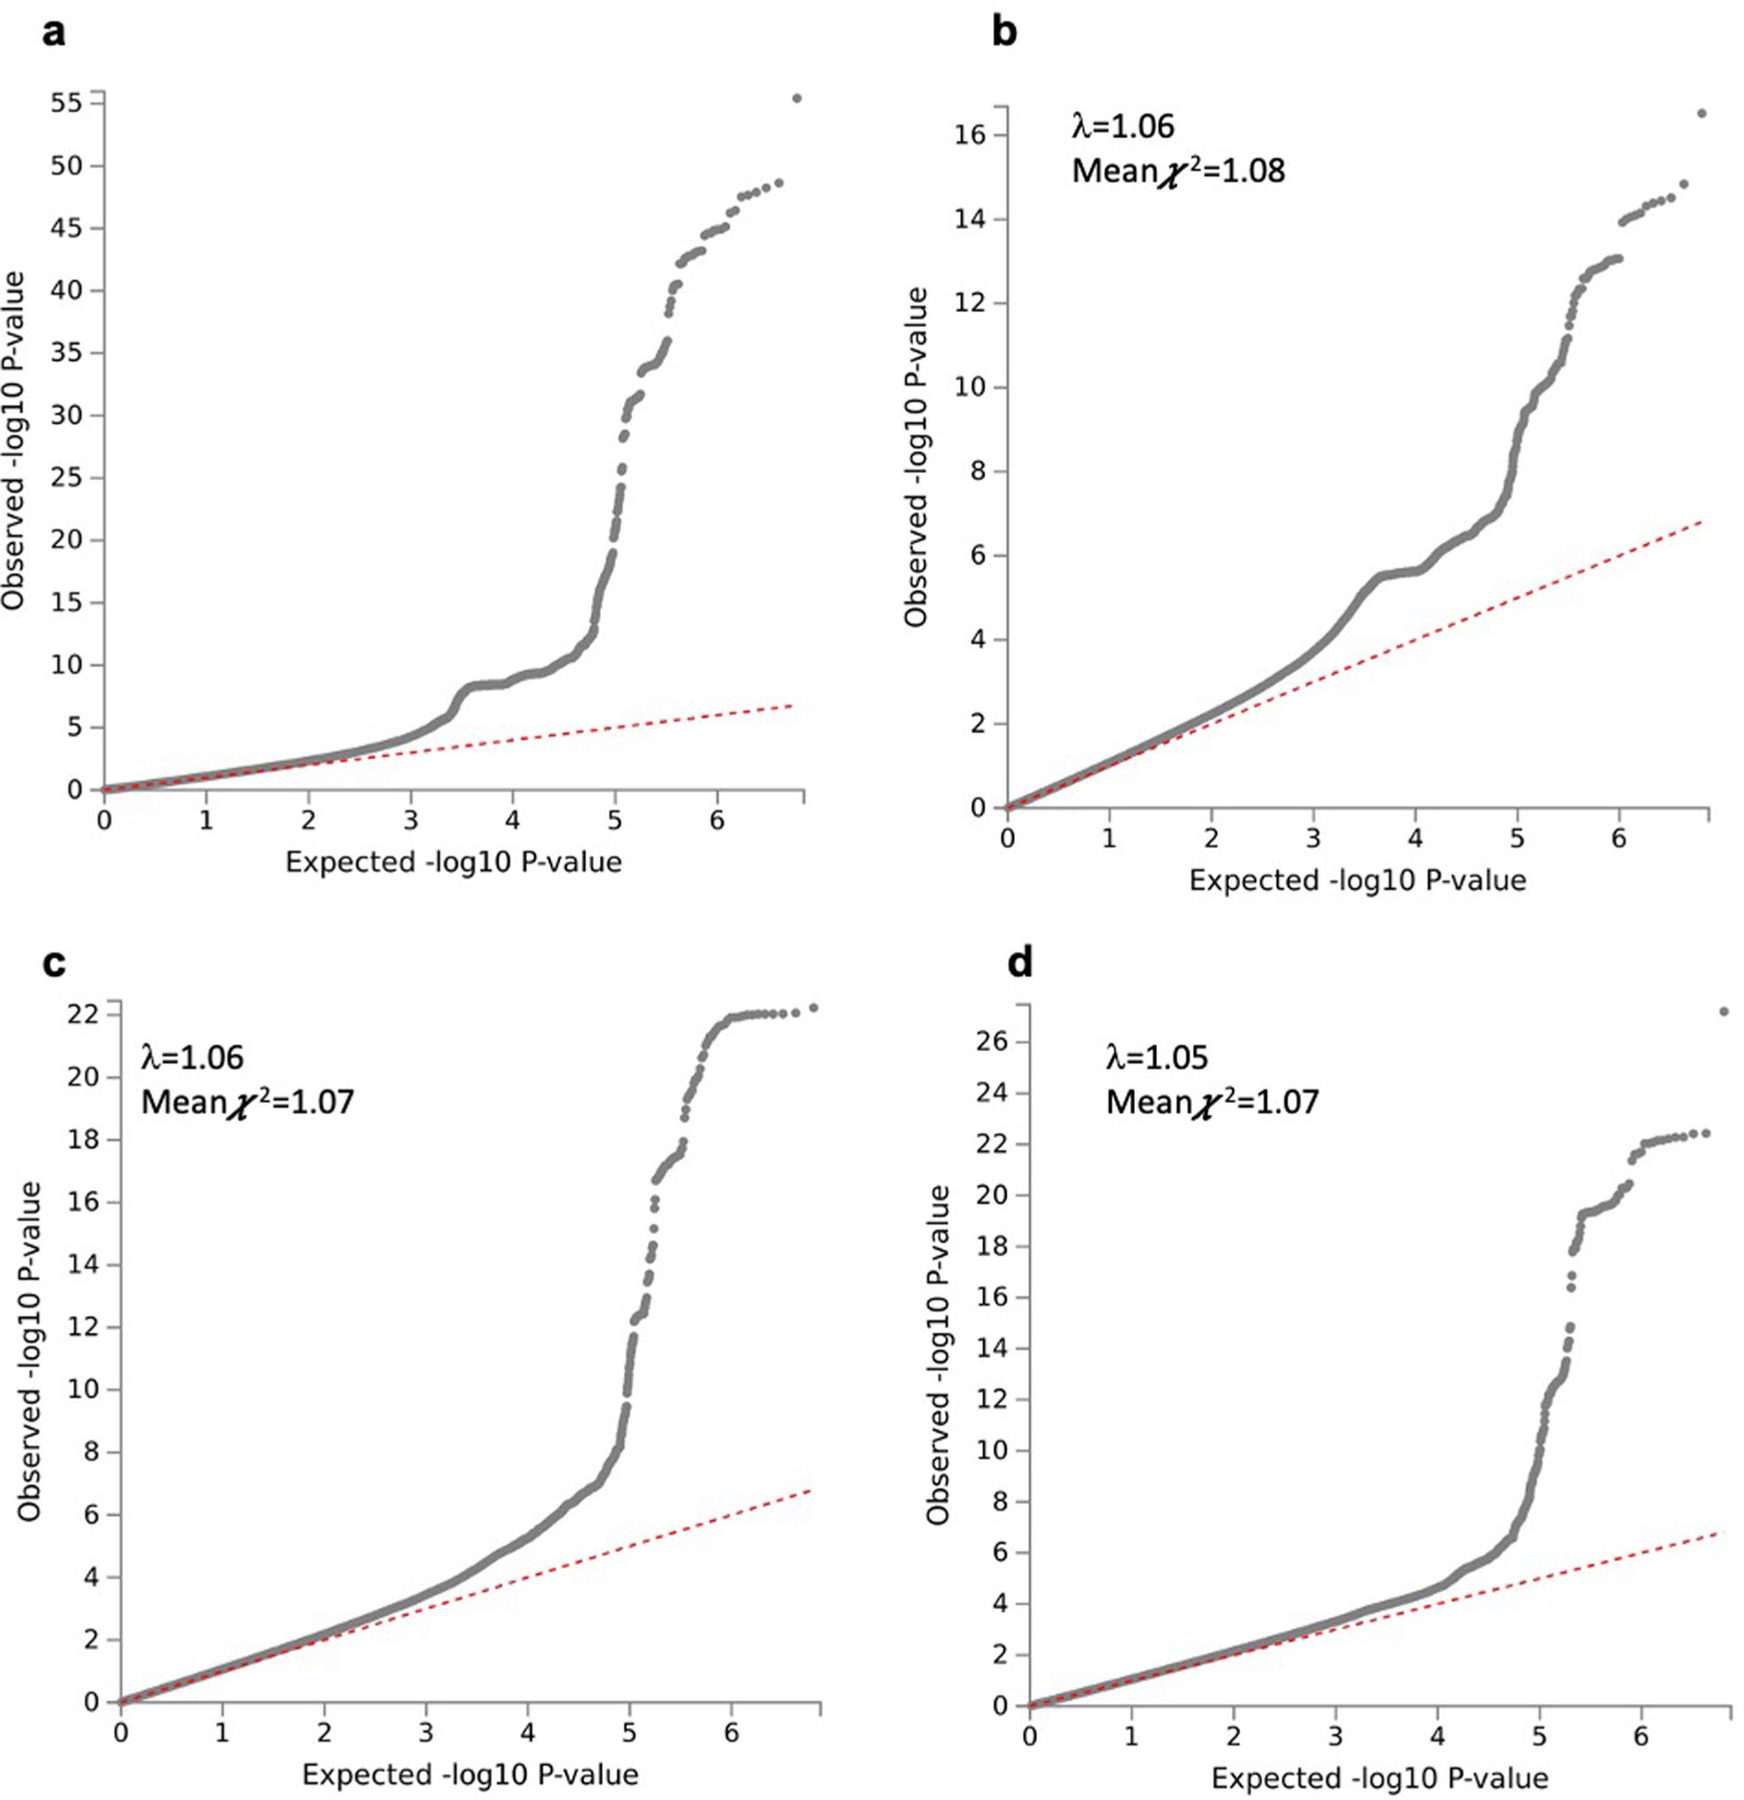
Extended Data Fig. 3 |. Quantile-quantile plot of the SNP-based associations with single-trait and multi-trait genome-wide association meta-analyses of 282,271 individuals.

Quantile–quantile plot of the SNP-based associations with multivariate (a), carbohydrate (b), fat (c), and protein intake (d). SNP P values were computed in METAL by weighting effect size estimates using the inverse of the corresponding standard errors.
