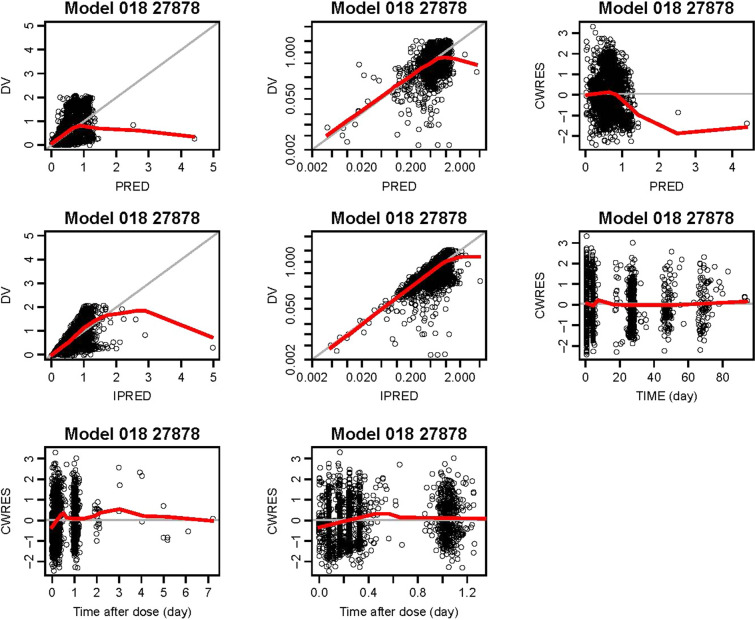
Fig. 2.
Final model (018) evaluation: goodness-of-fit plots for final model. Top row: observed versus population predicted venetoclax concentrations (linear and log scales); CWRES versus population predicted venetoclax concentrations. Second row: observed versus individual predicted venetoclax concentrations (linear and log scales); CWRES versus time. Bottom row: CWRES versus time after dose. The gray solid lines (showing plots of y = x or y = 0, as appropriate) are included for reference. The bold red lines are the lowess (local regression smoother) trend lines. CWRES conditional weighted residuals, DV observed concentrations, IPRED individual predictions of the model, PRED population predictions of the model, TIME time after the first dose

