Fig. 1.
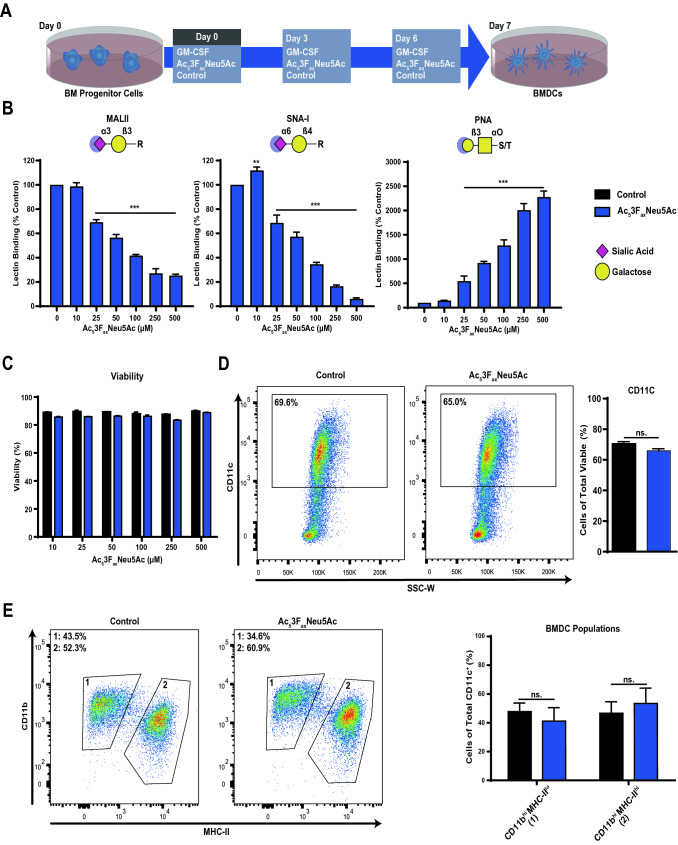
Ac53FaxNeu5Ac blocks sialic acid expression in BMDCs without affecting differentiation. A Schematic representation of the generation of BMDCs. BM cells from murine femurs and tibia were seeded into petri dishes containing culture medium and supplemented with GM-CSF and Ac53FaxNeu5Ac (0–500 µM) or DMSO. On days 3 and 6, the medium was replenished with fresh medium containing GM-CSF and Ac53FaxNeu5Ac (0–500 µM) or control DMSO. On day 7, the BMDCs were harvested. B Dose-dependent inhibition of sialic acid expression with Ac53FaxNeu5Ac. Expression of α2-3- and α2-6-linked sialic acids or uncapped galactose/Tn antigen on BMDCs was detected using the lectins MALII, SNA-I and PNA, respectively, from left to right. The lectin binding was normalized to control untreated cells. Representative bar diagrams show mean values ± SD of three technical replicates. C Percentage of viable cells in BMDC cultures treated with different concentrations of Ac53FaxNeu5Ac compared to control-treated cells. Representative bar diagrams show mean values ± SD of three technical replicates. D Expression of the DC differentiation marker CD11c on control and treated (250 µM Ac53FaxNeu5Ac) BMDCs. Representative dot plots show CD11c+ cells of control and treated (250 µM Ac53FaxNeu5Ac) BMDCs. Mean percentages ± SD CD11c+ cells of total viable cells are presented as bar diagram (n = 2). (E) Ratio of two GM-CSF BMDC culture populations within viable and CD11c+ BMDCs. Population 1 (left gate) is defined as CD11bhiMHC-IIlo and population 2 (right gate) as CD11bintMHC-IIlo. The gating strategy for the two populations is shown for control BMDC cultures and cultures treated with 250 µM Ac53FaxNeu5Ac. Quantification of both BMDC populations is shown as a bar diagram (n = 2) and the experiment was performed three times

