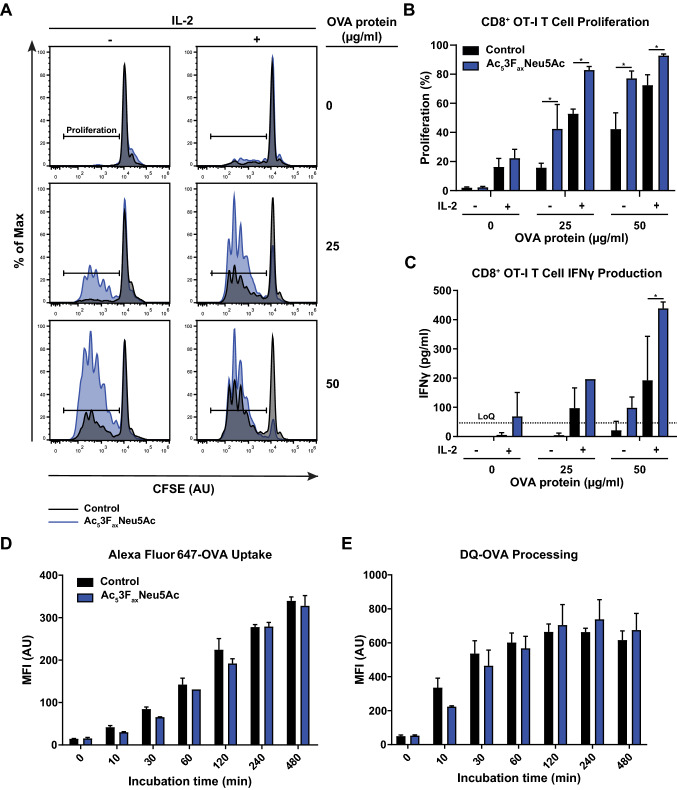
Fig. 3.
Ac53FaxNeu5Ac-treated BMDCs have increased capacity to induce CD8+ OT-I T cell proliferation. A–C CFSE-labeled CD8+ OT-I T cells were co-cultured (1:1 ratio) with control or Ac53FaxNeu5Ac-treated BMDCs pulsed with different concentrations of OVA protein, and in the presence or absence of IL-2. OT-I proliferation was determined by flow cytometry analysis using dilution of the CFSE signal. A Representative histograms depict CD8+ OT-I T cell proliferation after co-culture with control BMDCs (black) and Ac53FaxNeu5Ac-treated BMDCs (blue) for the different conditions. Bar diagrams show percentage of proliferated (B) CD8+ OT-I T cells and IFNγ levels in the co-culture supernatant (C) as average values ± SD of two biological replicates. The dotted line represents the IFNγ detection limit (LoQ). D, E Uptake of Alexa Fluor 647-OVA (D) and processing of DQ-OVA (E) by the BMDCs over time was quantified by flow cytometry. Data are presented as mean fluorescence intensity values ± SD of two biological replicates and all experiments were performed three times

