Fig. 4.
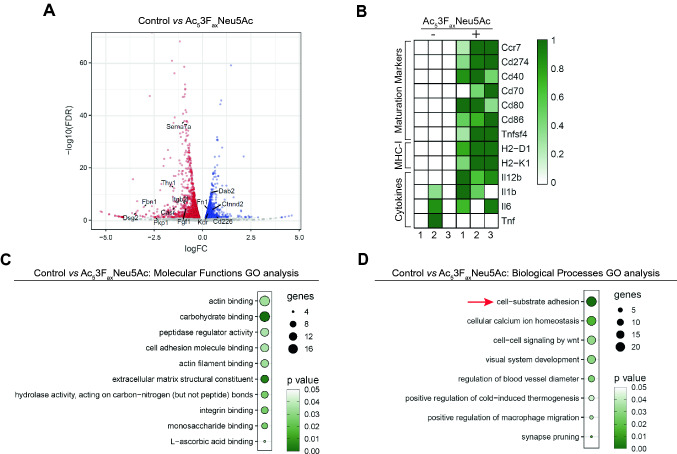
Differential gene expression in Ac53FaxNeu5Ac treated BMDCs reveals effects on cell–cell adhesion. A–D RNA seq analysis was performed on CD11c+ isolated BMDCs generated in the presence or absence of Ac53FaxNeu5Ac. A Comparative analysis of control and Ac53FaxNeu5Ac treated BMDCs. The volcano plot depicts the log fold change and FDR in a minus log 10 transformation. Significantly DEG (FDR < 0.05) are shown in red. Genes from the molecular functions GO term analysis ‘cell adhesion molecule binding’ are highlighted. B Expression profile of genes involved in T cell co-stimulation are displayed in a row scaled heatmap. GO term enrichment analysis showing top significantly altered Molecular Functions (C) and Biological Processes (simplified) (D). D GO term of interest is indicated with a red arrow. RNA seq was performed with three biological replicates

