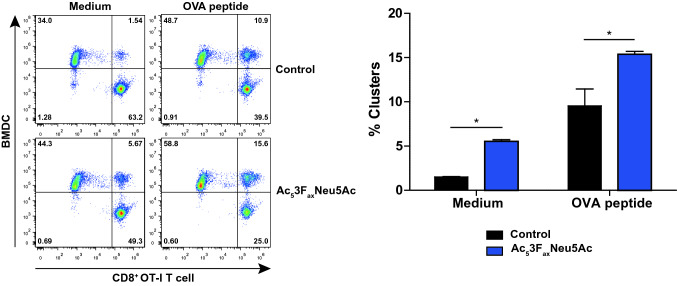
Fig. 5.
Reduced sialylation favors clustering between BMDCs and CD8+ OT-I T cells Ac53FaxNeu5Ac and control-treated BMDCs were pulsed with OVA peptide or medium. For cell identification during flow cytometry acquisition, BMDCs were labeled with CellTrace Violet dye, and CD8+ OT-I T cells were labeled with CellTrance Far Red dye. After 45 min of incubation at 37 °C, cluster formation was assessed by flow cytometry. Representative dot plots show BMDCs–CD8+ OT-I T cell clusters (left) and quantification is shown as bar diagram (right). Percentages are shown as mean values ± SD of two biological replicates and experiments were performed three times

