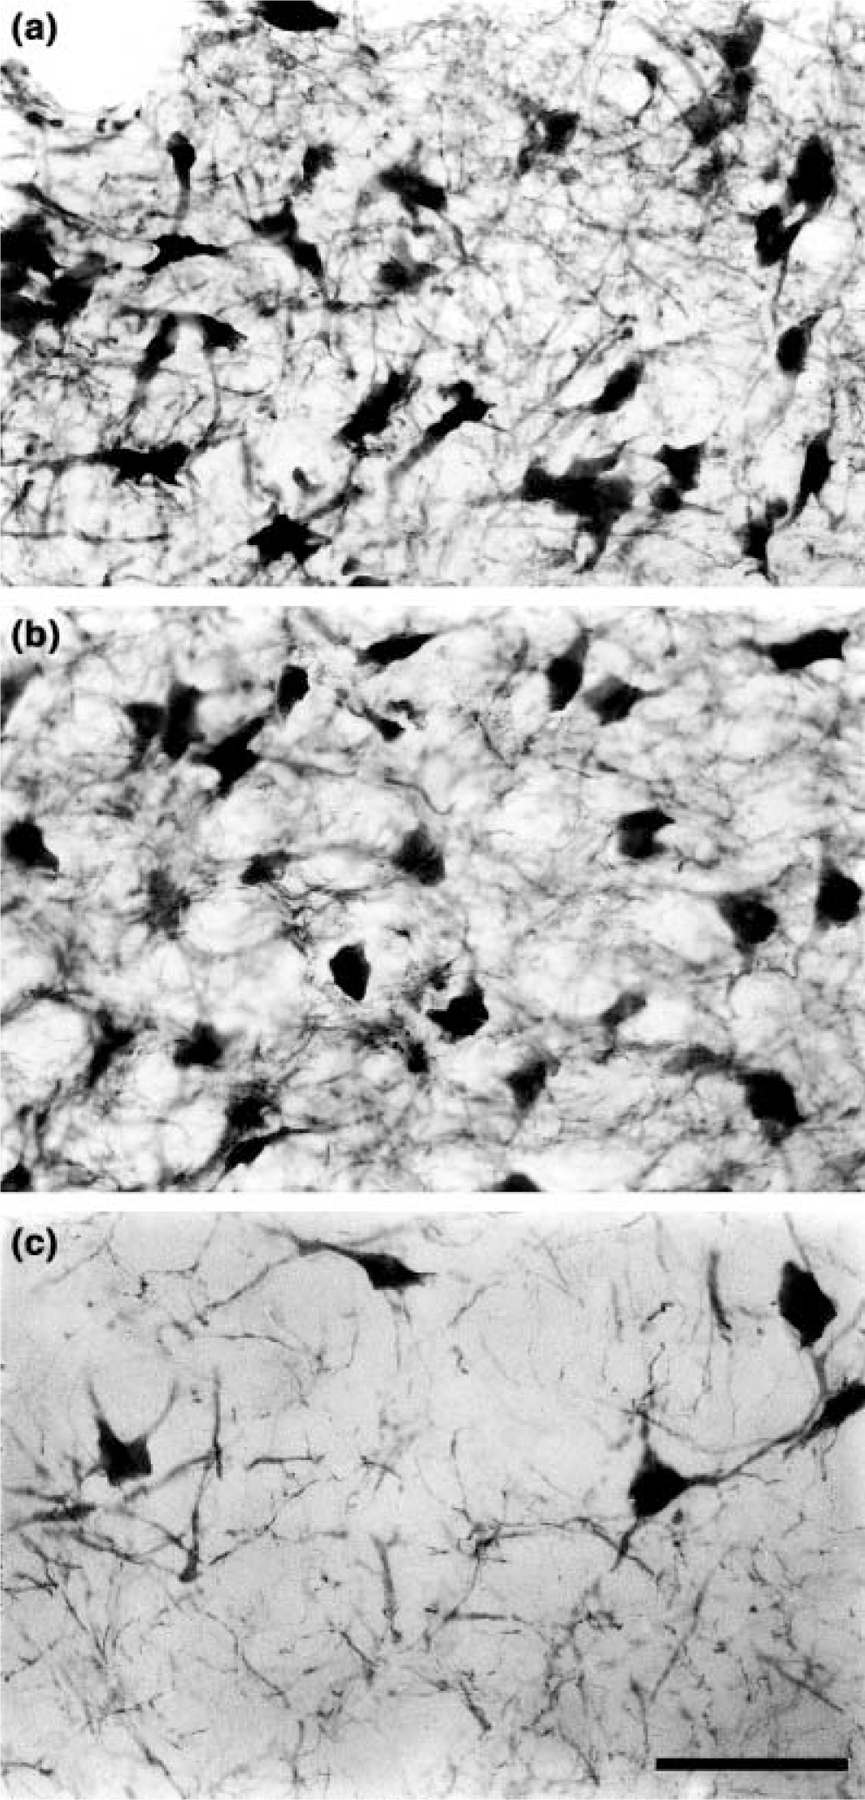
Figure 2.

High power photomicrographs of cells in three of the subdivisions described in the present study. (a) Tyrosine hydroxylase immunoreactive cells in the A6 dorsal subdivision. Note the high cellular density and extensive local plexus formed by the dendrites of these cells. (b) Cells of the A6 ventral subdivision. Note the lower cellular density and the similarly reduced density of the local dendritic plexus. (c) Cells of the A7 subdivision. Here the cellular density is lowest, however, this varies across this subdivision, with the periphery exhibiting the lowest cellular density. The density of the dendritic plexus is also significantly lower. Scale bar = 50 µm, applies to all plates.
