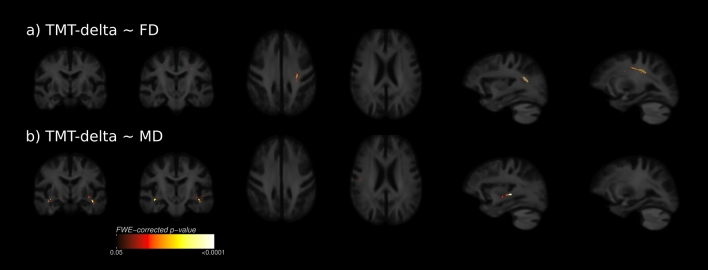
Figure 5.
Whole-brain clinical fixel-based analysis and TBSS. Fixels and voxels that show a significant linear relationship (FWE-corrected p < 0.05) between metrics and the difference of TMT-B and TMT-A (TMT-delta) are visualised on the population template. (a) the SLF showed a significant linear relationship between FD and TMT-delta. (b) the MD was significantly correlated with TMT-delta bilaterally in temporal areas traversed by the AF and ILF. AF arcuate fasciculus, FD fibre density, FC fibre-bundle cross-section, FDC Fibre density and cross-section, ILF inferior longitudinal fasciculus, MD mean diffusivity, TMT-delta difference of trail making test b and a. Figure was produced using inkscape and mrview from MRtrix3 (https://www.mrtrix.org/).

