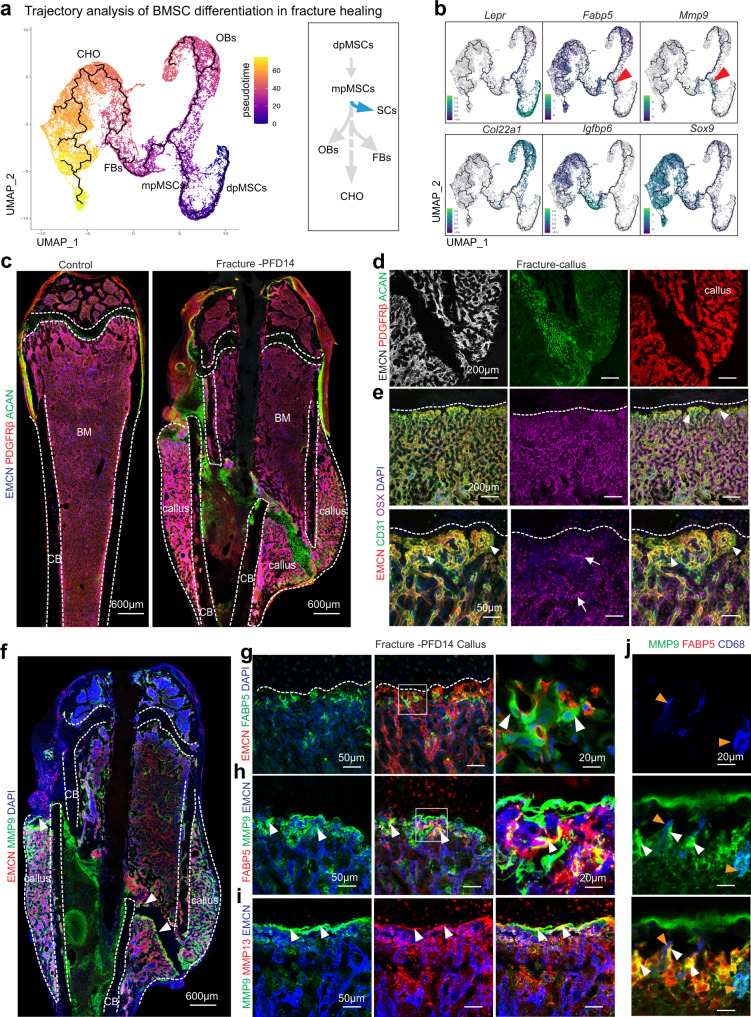
Fig. 7. Septoclasts in fracture healing.
a, b. Monocle trajectory analysis of BMSC lineage cell differentiation path during fracture repair (a). Expression of marker genes is displayed in trajectory. Red arrowhead indicates Mmp9+ and Fabp5+ cells in proximity of mpMSC cluster (b). c–e Tile scan confocal images of PFD14 and age-matched control femur showing ECs (EMCN, blue), BMSCs (PDGFRβ, red) and chondrocytes (ACAN, green) (c). High magnification images showing avascular regions of callus containing ACAN+ chondrocytes and PDGFRβ+ BMSCs associated with vessels (d). Low and high magnification images showing CD31hi (green) and EMCNhi (red) vessels and endothelial buds (arrowheads) in proximity of callus chondrocytes. OSX+ (purple) cells (arrows) are abundant around vessels (e). f–j Tile scan confocal image of PFD14 femur showing MMP9 (green) at the vessel front in the callus (arrowheads) and, at lower level, in the metaphysis near growth plate. Dashed lines mark cortical bone (CB), bone marrow (BM), callus area, and growth plate (f). Representative confocal image of PFD14 callus with FABP5+ (green) SCs associated with distal EMCN+ (red) vessels (arrowheads) (g). High magnifications images show MMP9 and MMP13 immunosignals in the region containing SCs (arrowheads) (h, i). Weaker MMP9 signals relative to SCs (white arrowheads) mark CD68+ (blue) OCs (orange arrowheads) in the PFD14 callus (j). c–i (control = 5 and fracture = 4) independent biological samples.

