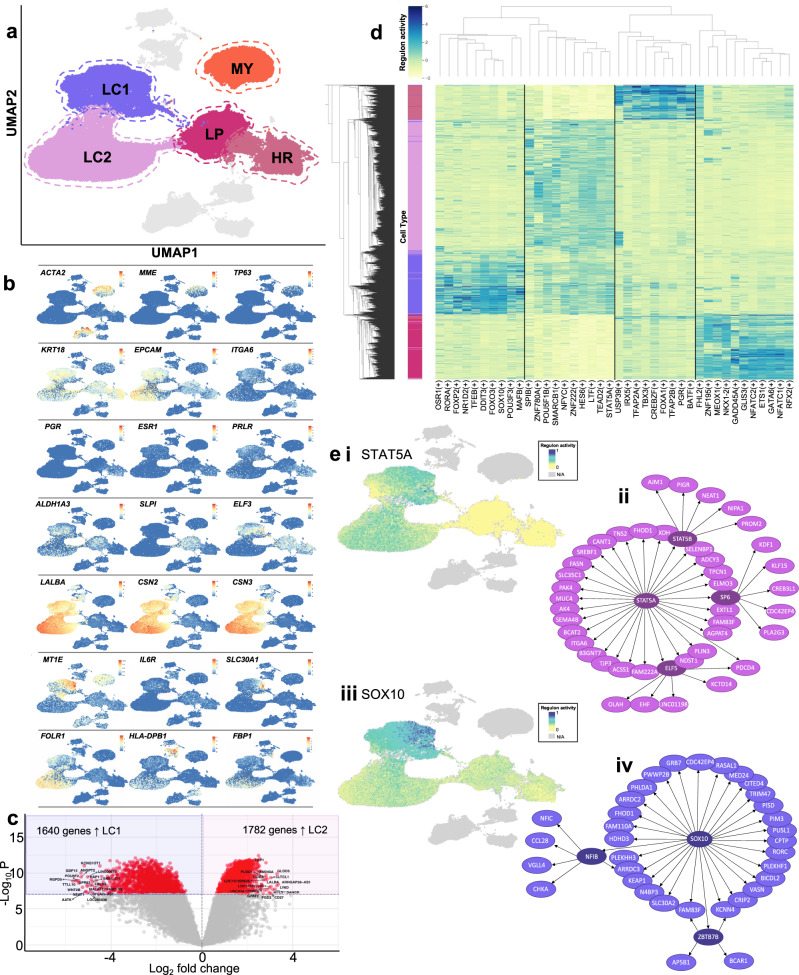
Fig. 2. Clustering analysis of non-lactating (NMC) and lactation-associated (LMCs) mammary epithelial cells reveals different subpopulations arising from different developmental stages.
a Five major epithelial clusters were identified in our data set consisting of NMC myoepithelial (MY), luminal hormone-responsive (HR) and luminal progenitor (LP) clusters and LMC major luminal clusters 1 and 2 (LC1 and LC2). b Uniform manifold approximation and projections (UMAPs) coloured by marker genes characterizing the various clusters. c Volcano plot displaying the findings of the differential gene expression analysis revealed 1640 genes more highly expressed in LC1 compared to 1782 genes highly expressed in LC2. Significant genes are in red with the top 10 being annotated. d Top 10 regulons significantly upregulated in each luminal cell cluster. e Significant regulons found in LCs. i UMAP of STAT5A regulon activation in luminal cells and ii genes associated with STAT5A regulon. iii UMAP of SOX10 regulon activation in luminal cells and iv genes associated with SOX10 regulon.

