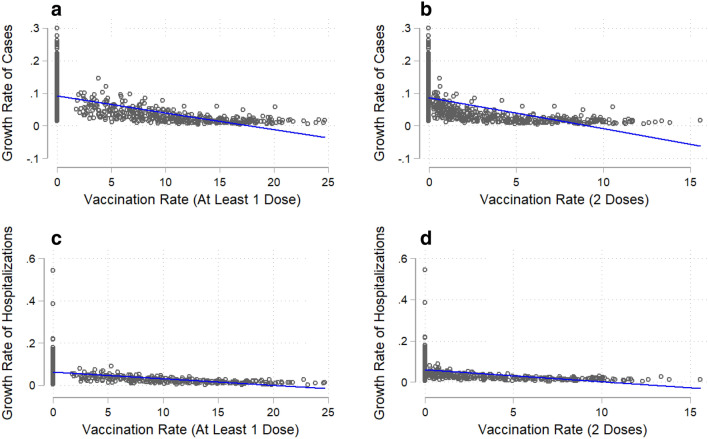
Figure 2.
COVID-19 infections (total cases and hospitalizations) and vaccination rate. Vaccination rate is the number of individuals vaccinated per hundred. The solid line in each figure is a fitted linear curve between the growth rate of total cases/hospitalizations and vaccination rate. (a), Association between the growth rate of total cases and at least 1 dose of vaccination (coefficient = − 0.006, R2 = 35.3%). (b) Association between the growth rate of total cases and 2 doses of vaccination (coefficient = − 0.013, R2 = 28.6%). (c) Association between the growth rate of total hospitalizations and at least 1 dose of vaccination (coefficient = − 0.003, R2 = 20.8%). (d), Association between the growth rate of total hospitalizations and 2 doses of vaccination (coefficient = − 0.007, R2 = 16.6%).

