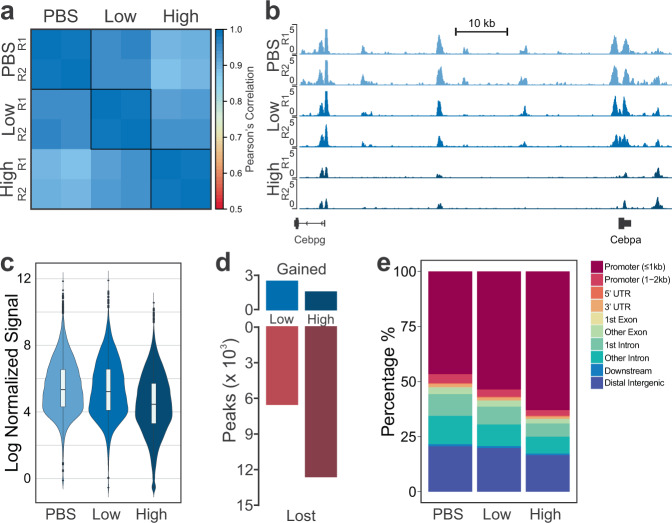
Fig. 2. Overview of epigenomic data for murine BMDMs dosed with PBS, low-dose LPS, or high-dose LPS.
a Pearson’s correlation of normalized H3K27ac signal around promoter regions (TSS ± 2 kb). b Tracks of normalized H3K27ac signal for replicates dosed with PBS, low-dose LPS, or high-dose LPS (from top to bottom). Tracks are aligned in mm10 and the region displayed is chr7:35,042,108-35,138,618. c Distribution of normalized H3K27ac signal at peaks (n = 29,071). The middle bar of the boxplot denotes the median. The upper and lower bounds of the box correspond to the 75th and 25th percentile, respectively. Each whisker spans up to the range of 1.5 * interquartile range from the edge of the box. d Number of peaks gained or lost in low-dose or high-dose conditions compared to PBS. e Percentage of peaks at genomic locations.

