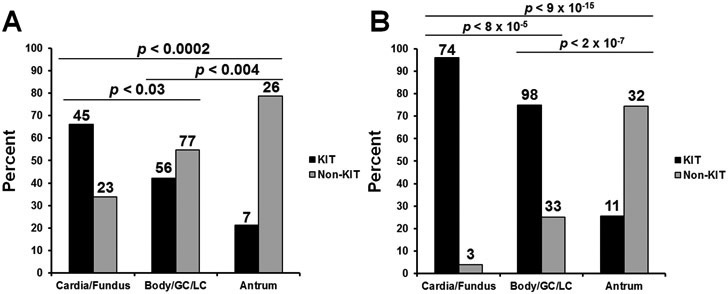
Figure 1. KIT vs non-KIT mutation rates within the stomach.
A. Bar graph representing analysis of 234 gastric GIST cases in the National Cancer Database (NCDB) database with multi-gene genetic testing. Cases are stratified by stomach location and KIT mutation (black) versus non-KIT (grey) status. B. Bar graph representing analysis of 236 gastric GIST cases in the in the Collaborative Cohort (UCSD/NKI/OHSU) with genetic testing. Cases are stratified by stomach location and KIT mutation status.

