
Figure 4.
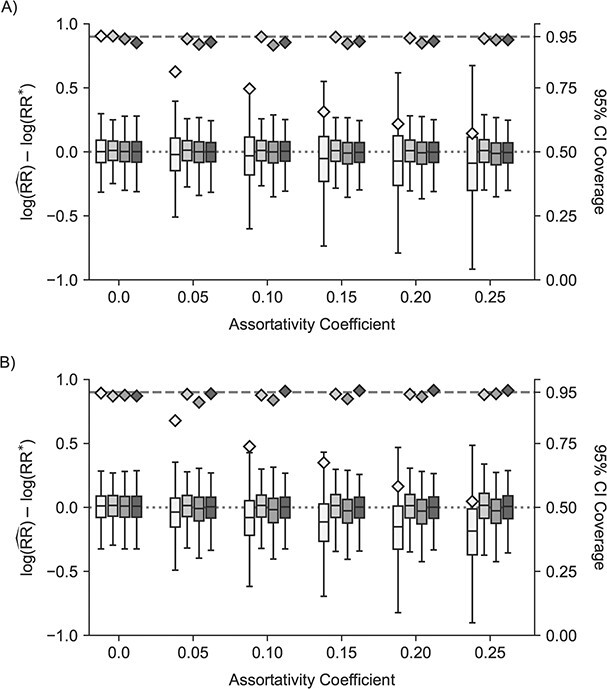
Study of Exclusion Criteria in a University Population (eX-FLU) and stochastic-block network simulation results for a hypothetical vaccine according to varying assortativity coefficients. A) eX-FLU network; B) stochastic-block network. From light to dark gray (left to right), results are shown for the traditional model, cluster model, 1-step model, and 2-step model. The y-axis and box plots show the bias, defined as the regression model log-transformed risk ratio (RR) minus the true log-transformed RR. Whiskers indicate the 2.5th and 97.5th percentiles. The z-axis and diamonds show the 95% confidence interval (CI) coverage, defined as the proportion of 95% CIs that contained the true value. The x-axis indicates the value for the assortativity coefficient in expectation. Higher values indicate greater assortativity.  , estimated RR for the unit-treatment effect;
  , true RR for the unit-treatment effect.