
Figure 1.
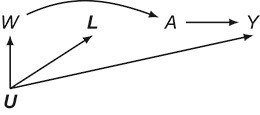
Causal directed acyclic graph corresponding to target trial 1. For each surgeon,  is operative volume during interval
  , Lk is a vector of covariates during
  (e.g., surgeon characteristics, average patient characteristics, average hospital characteristics, and mortality risk),
  is operative volume during
  (under full adherence to assignment),
  is the 90-day mortality risk of patients who underwent an operation during
  , and U is a vector of unmeasured covariates. Directed edges between
  , Lk, and
  are omitted for simplification.