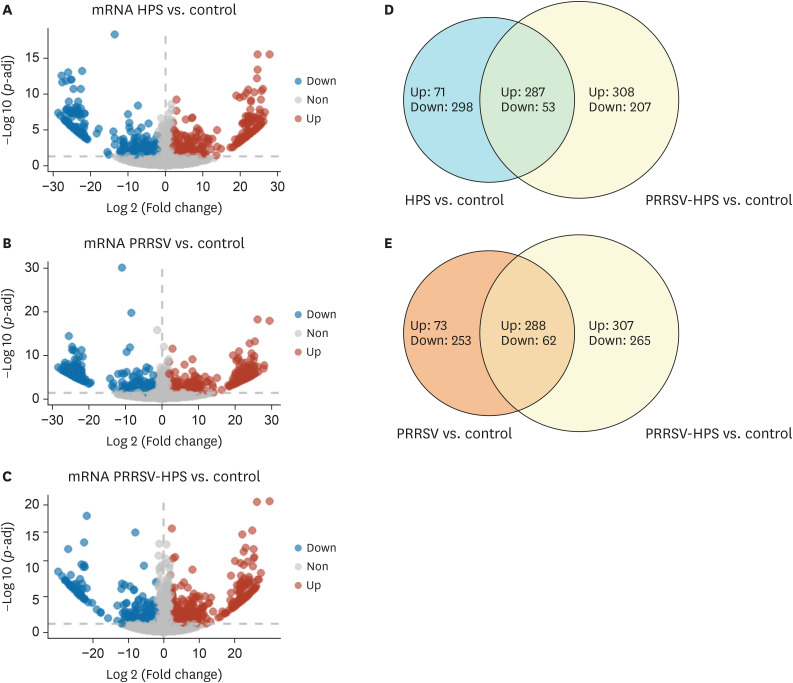
Fig. 2. Volcano plots and Venn diagrams of different expression transcripts from HPS, PRRSV, and PRRSV-HPS infected groups. (A-C) Blue indicates significantly ‘Down’, red indicates significantly ‘Up’, and grey means ‘Non’. (D, E) Light blue indicates HPS vs. control DEGs, orange indicates PRRSV vs. control DEGs, yellow indicates PRRSV-HPS vs. control DEGs, and the part of the 2 circles that intersects indicates genes common to co-infection and single infection.
PRRSV, porcine reproductive and respiratory syndrome virus; HPS, Haemophilus parasuis; Up: up-regulated genes; Down: down-regulated genes; Non: not differentially expressed genes; DEG, differentially expressed gene.

