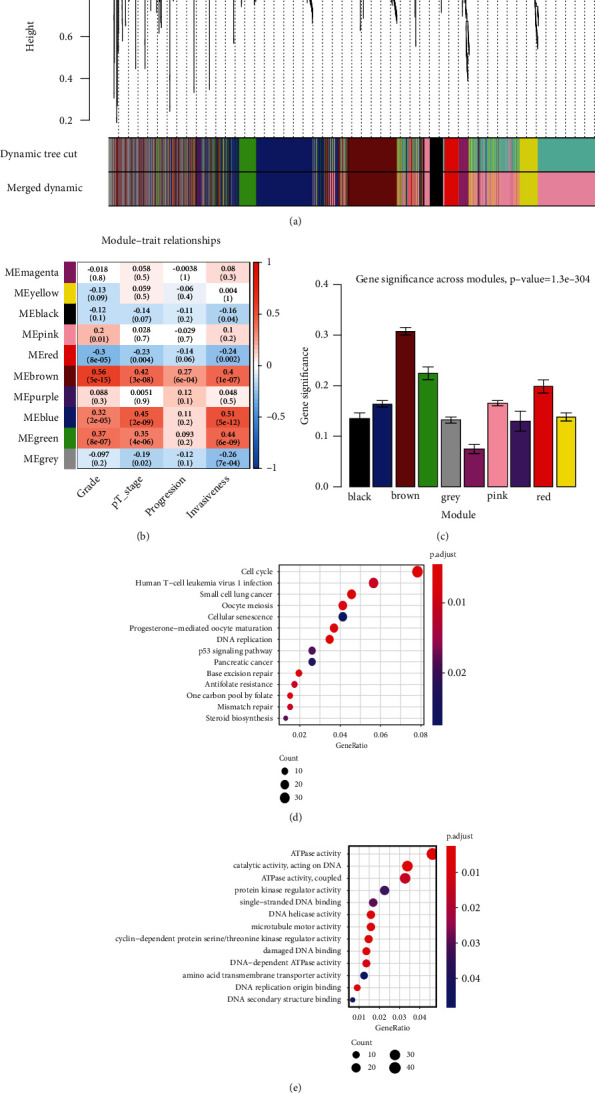
Figure 1.

Weighted gene coexpression network analysis identified key modules associated with BCa progression. (a) Dendrogram of all selected genes clustered based on a dissimilarity measure (1-TOM). (b) Heatmap of the correlation between module eigengenes and different clinical information of BCa. (c) Distribution of the average gene significance and errors in the modules associated with tumor stage and grade of BCa. (d) Bubble chart showing Gene Ontology and KEGG pathway enrichment analysis based on all genes in the brown module. The x-axis represents -log10 (p value), and the y-axis represents the significantly enriched pathways.
