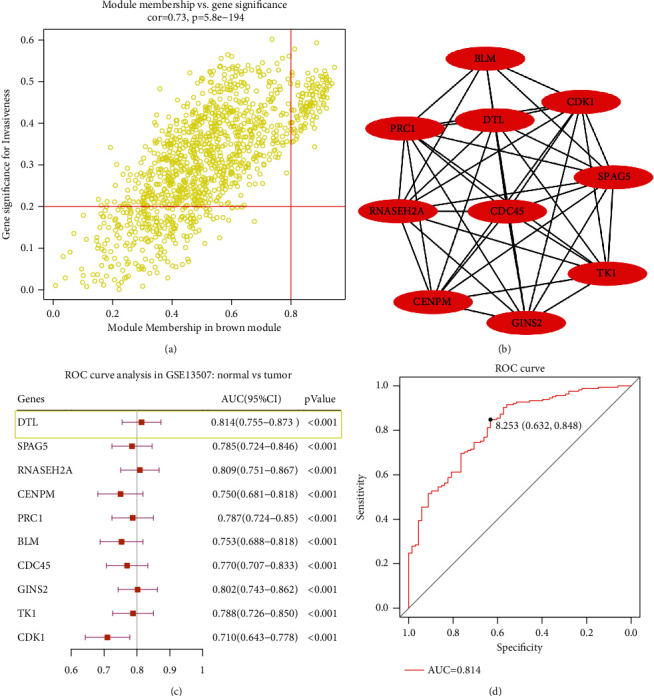
Figure 2.

DTL was a key gene and an excellent diagnostic biomarker in BCa. (a) The scatter plot of all genes in the brown module; those circles located in the upper right indicate the key genes in these modules. (b) The protein-protein interaction network identified top 10 hub genes based on the STRING database. (c) ROC curve analysis of the selected top 10 hub genes in GSE13507. (d) DTL diagnosis ROC curve analysis in GSE13507.
