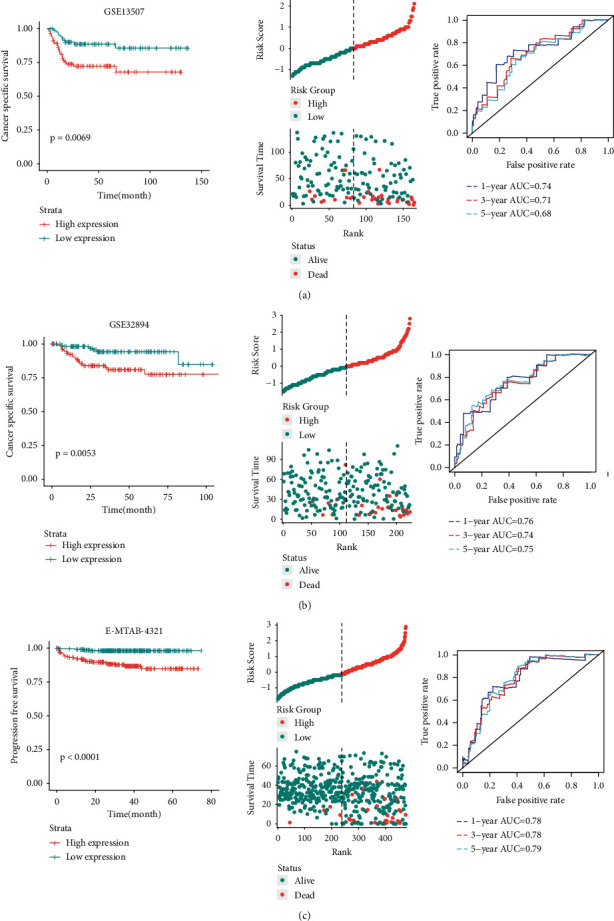
Figure 4.

Prognostic analysis of DTL in three independent datasets. (a) GSE13507 dataset. (b) GSE32894 dataset. (c) E-MTAB-4321 dataset. Left panels indicated Kaplan-Meier survival curves in three datasets, and patients with DTL high expression represented dramatically unfavorable survival than those with DTL low expression. Middle panels indicated the distributions of all the patients' survival status in the DTL low-expression group and high-expression group. Right panels indicated the time-dependent ROC curves for survival prediction in three datasets.
