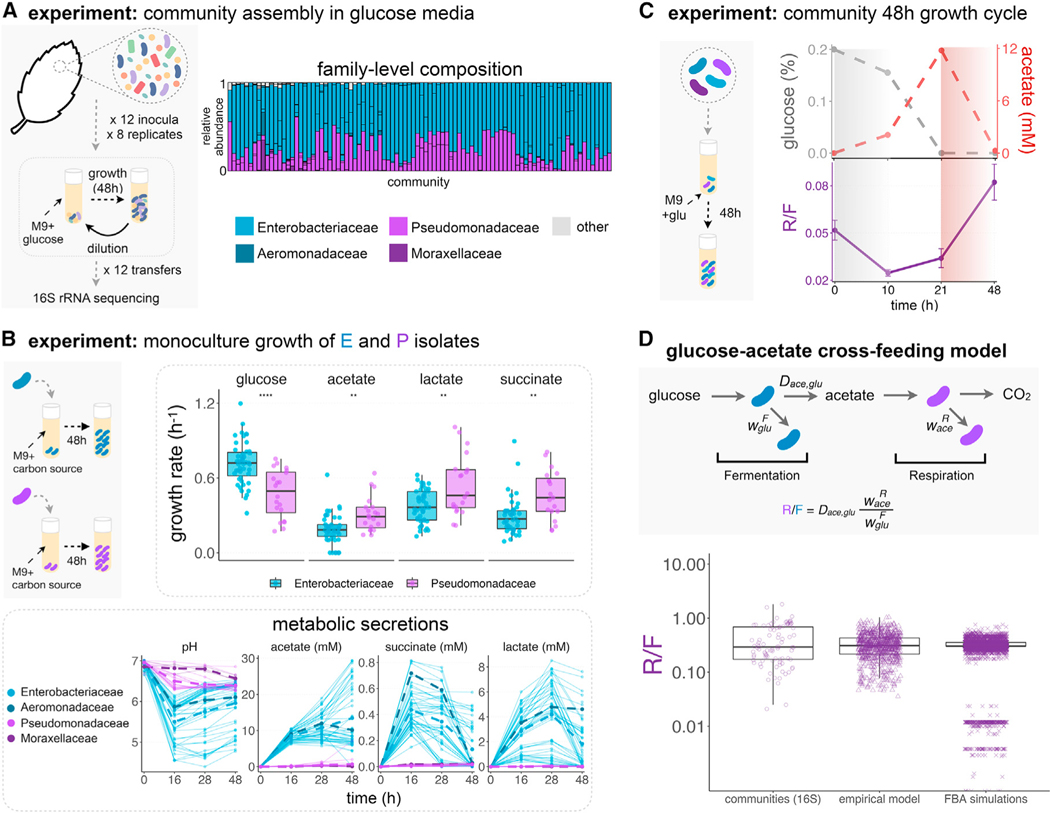
Figure 1. Emergent metabolic structure in self-assembled microbial communities.
(A) Barplots show the relative abundance of the dominant families (Enterobacteriaceae, Pseudomonadaceae, Aeromonadaceae, and Moraxellaceae) in 92 communities started from 12 leaf or soil inocula (7–8 replicates each) after assembly in minimal media with glucose for 12 growth/dilution cycles (data from Goldford et al., 2018). Other families are shown in gray.
(B) Isolates belonging to different families were grown in monoculture for 48 h in minimal media supplemented with a single carbon source (CS) (glucose, acetate, lactate, or succinate) (N = 73, Figure S2). Each dot corresponds to an isolate’s maximum growth rate. Note that **** indicates p ≤ 0.0001, ** indicates p ≤ 0.01, two-sample t test. We measured the pH and quantified the amount of acetate, lactate, and succinate in the medium at various time points for all isolates. The dashed lines represent the mean concentrations for isolates of each family.
(C) Communities were thawed and grown in minimal media with glucose for a single incubation time. Samples were taken at 10, 21, and 48 h, and we measured the R/F ratio and the concentrations of glucose and acetate in the medium. Only one representative community (out of N = 9) is shown. See Figure S6 for other communities. The R/F ratio represents the mean ± SD of the CFU ratios calculated by bootstrapping (N = 1,000 replicates).
(D) Observed and predicted R/F ratio using a simple resource-partitioning model. The model assumes that the glucose is consumed by the fermentative specialist (F), whereas the acetate released as a metabolic by-product is consumed by the respirative specialist (R). Communities 16S: R/F ratio observed experimentally in the glucose communities described in Figure 1A (median = 0.29, Q1 = 0.17, Q3 = 0.69, N = 92). Empirically calibrated model: R/F ratio empirically calculated using parameters obtained from 47 Enterobacteriaceae isolates and 18 Pseudomonas isolates (STAR Methods; Figure S9) (median = 0.31, Q1 = 0.22, Q3 = 0.43, N = 846). FBA calibrated model: using Flux Balance Analysis, we calculated the biomass obtained from glucose fermentation by Enterobacteriaceae strains (F) and the biomass obtained from consumption of the F’s metabolic byproduct, acetate, by Pseudomonas strains (R). The predicted ratio between R and F biomass was calculated for 74 Pseudomonas metabolic models and 59 Enterobacteriaceae metabolic models. The simulations predict a median R/F ratio of ∼0.303 (Q1 = 0.302, Q3 = 0.356, N = 4,366) (Figures S9 and S10). Each dot represents a different Pseudomonas/Enterobacteriaceae pair.

