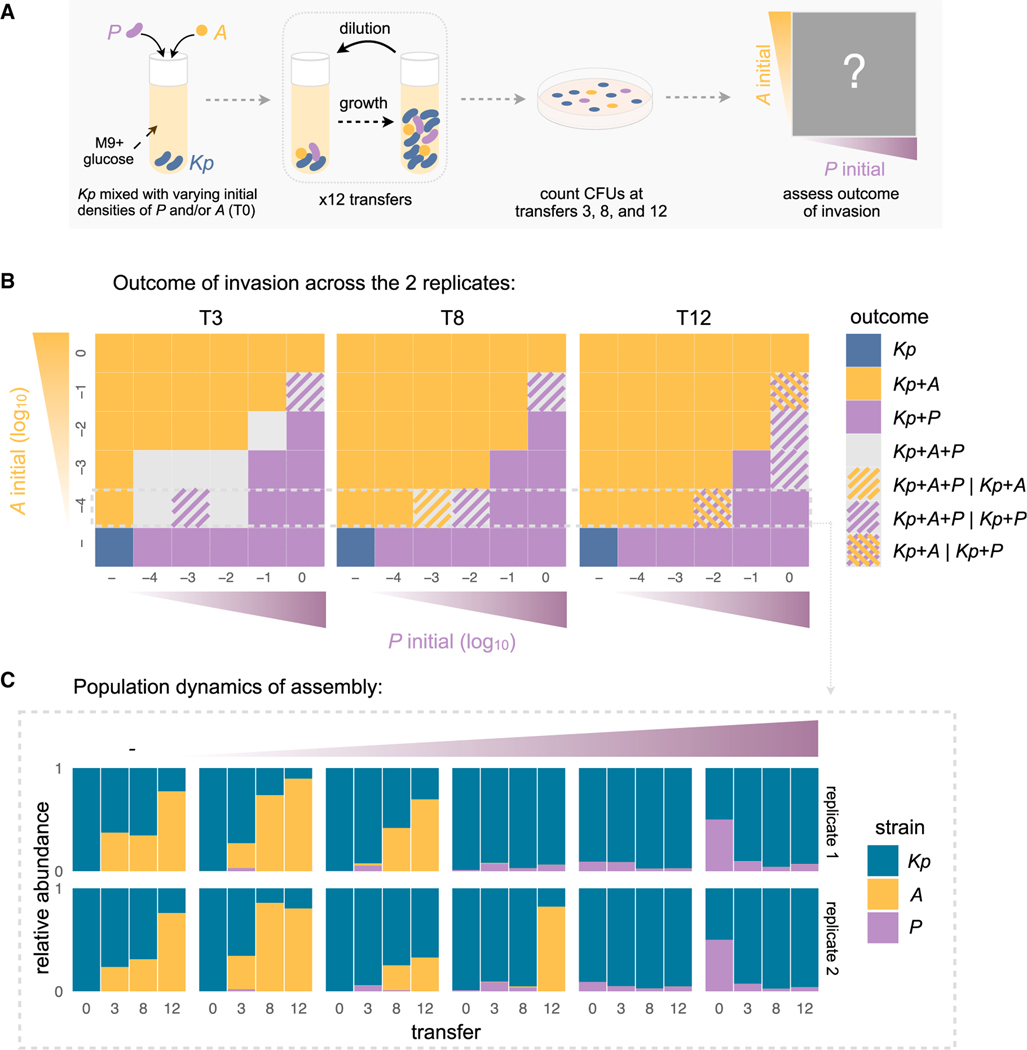
Figure 3. Multistable coexistence between two organic acid specialists explains the alternative attractors in community composition.
(A) We isolated the three dominant strains—Klebsiella (Kp), Alcaligenes (A), and Pseudomonas (P) that make up the two major alternative attractors and grew them in a pairwise coculture (Kp+A or Kp+P) or in a three-member consortia (Kp+A+P) by mixing Kp with different initial densities of A and/or P (see STAR Methods). These reconstituted communities were grown in the same conditions as the top-down assembly communities for 12 transfers (STAR Methods).
(B) Phase portrait showing the state of the community after T = 3, 8, and 12 transfers for 2 biological replicates. A square is colored yellow if a community that was started there contained A but not P at time T, and it is purple if it contained P but not A. It is gray if both A and P were present in both replicates. Squares with a seamless pattern show states where the two replicates exhibit different outcomes. We can see that the phase portrait is divided in two regions: the upper-left diagonal is made up by the basin of attraction of A dominated communities, whereas the bottom-right diagonal contains the basin of attraction for P dominated communities. A and P generally mutually exclude each other depending on their starting densities. See Figure S14 for the phase portraits of the two biological replicate experiments separately.
(C) Temporal dynamics of the relative abundance of each taxa for a subset of the communities shown in (B) (the 2 replicates are shown separately). See Figure S14 for the time series of all pairwise initial conditions of the phase portrait.

