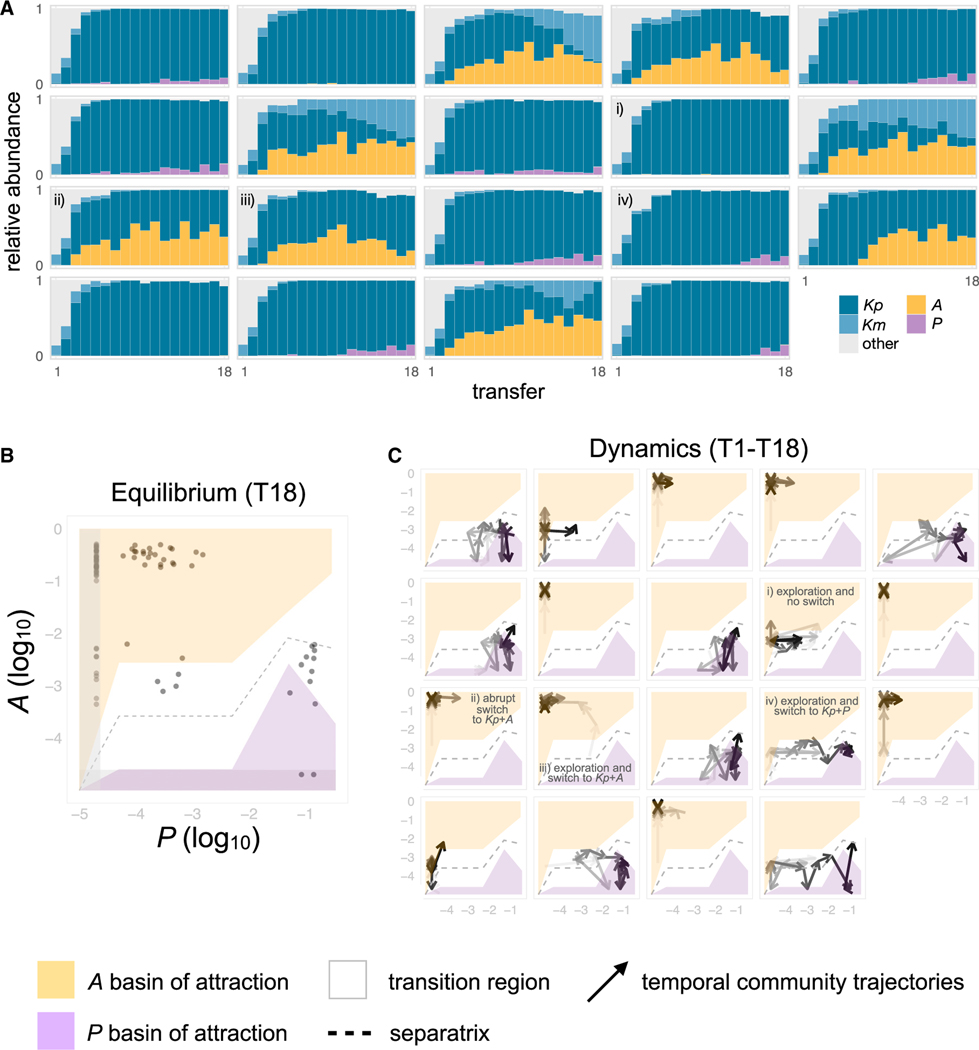
Figure 4. Multistable metabolic attractors between two organic acid specialists.
(A) Temporal dynamics for a subset of the replicate communities shown in Figure 2B (N = 19). Replicate communities were all started from the same inoculum and serially transferred to fresh minimal media with glucose every 48 h for a total of 18 growth-dilution cycles. Only the top four dominant ESVs (Kp, Km, P, and A) at transfer 18 are colored, other ESVs are shown in gray.
(B and C) Phase diagram showing the basins of attraction for Alcaligenes (A) dominated (yellow area) and for Pseudomonas (P) dominated (purple area) states, inferred from the outcome of the bottom-up invasion experiment in Figure 3B (STAR Methods), separated by a transition region (white area). The gray dashed line indicates the separatrix between the two basins of attraction. In (B), the dots show the relative abundance of A and P at Transfer 18 (N = 92) for the communities shown in Figure 2B. The gray shaded areas indicate the regions of low A and low P that are below the detection level of amplicon sequencing. In (C), overlaid are the trajectories of the relative abundance of A and P for all N = 19 communities shown in panel (A). The arrows become darker with time (i.e., from T1 to T18). At T0 (original inoculum), P was found at a relative abundance of 0.0086, whereas A was undetectable. We highlight four typical outcomes: the community explores the landscape and remains in the metastable state of low R/F (i), the community switches abruptly to the A dominated state (ii), the community explores the landscape and switches to the A dominated state (iii), and the community explores the landscape and switches to the P dominated state (iv).

