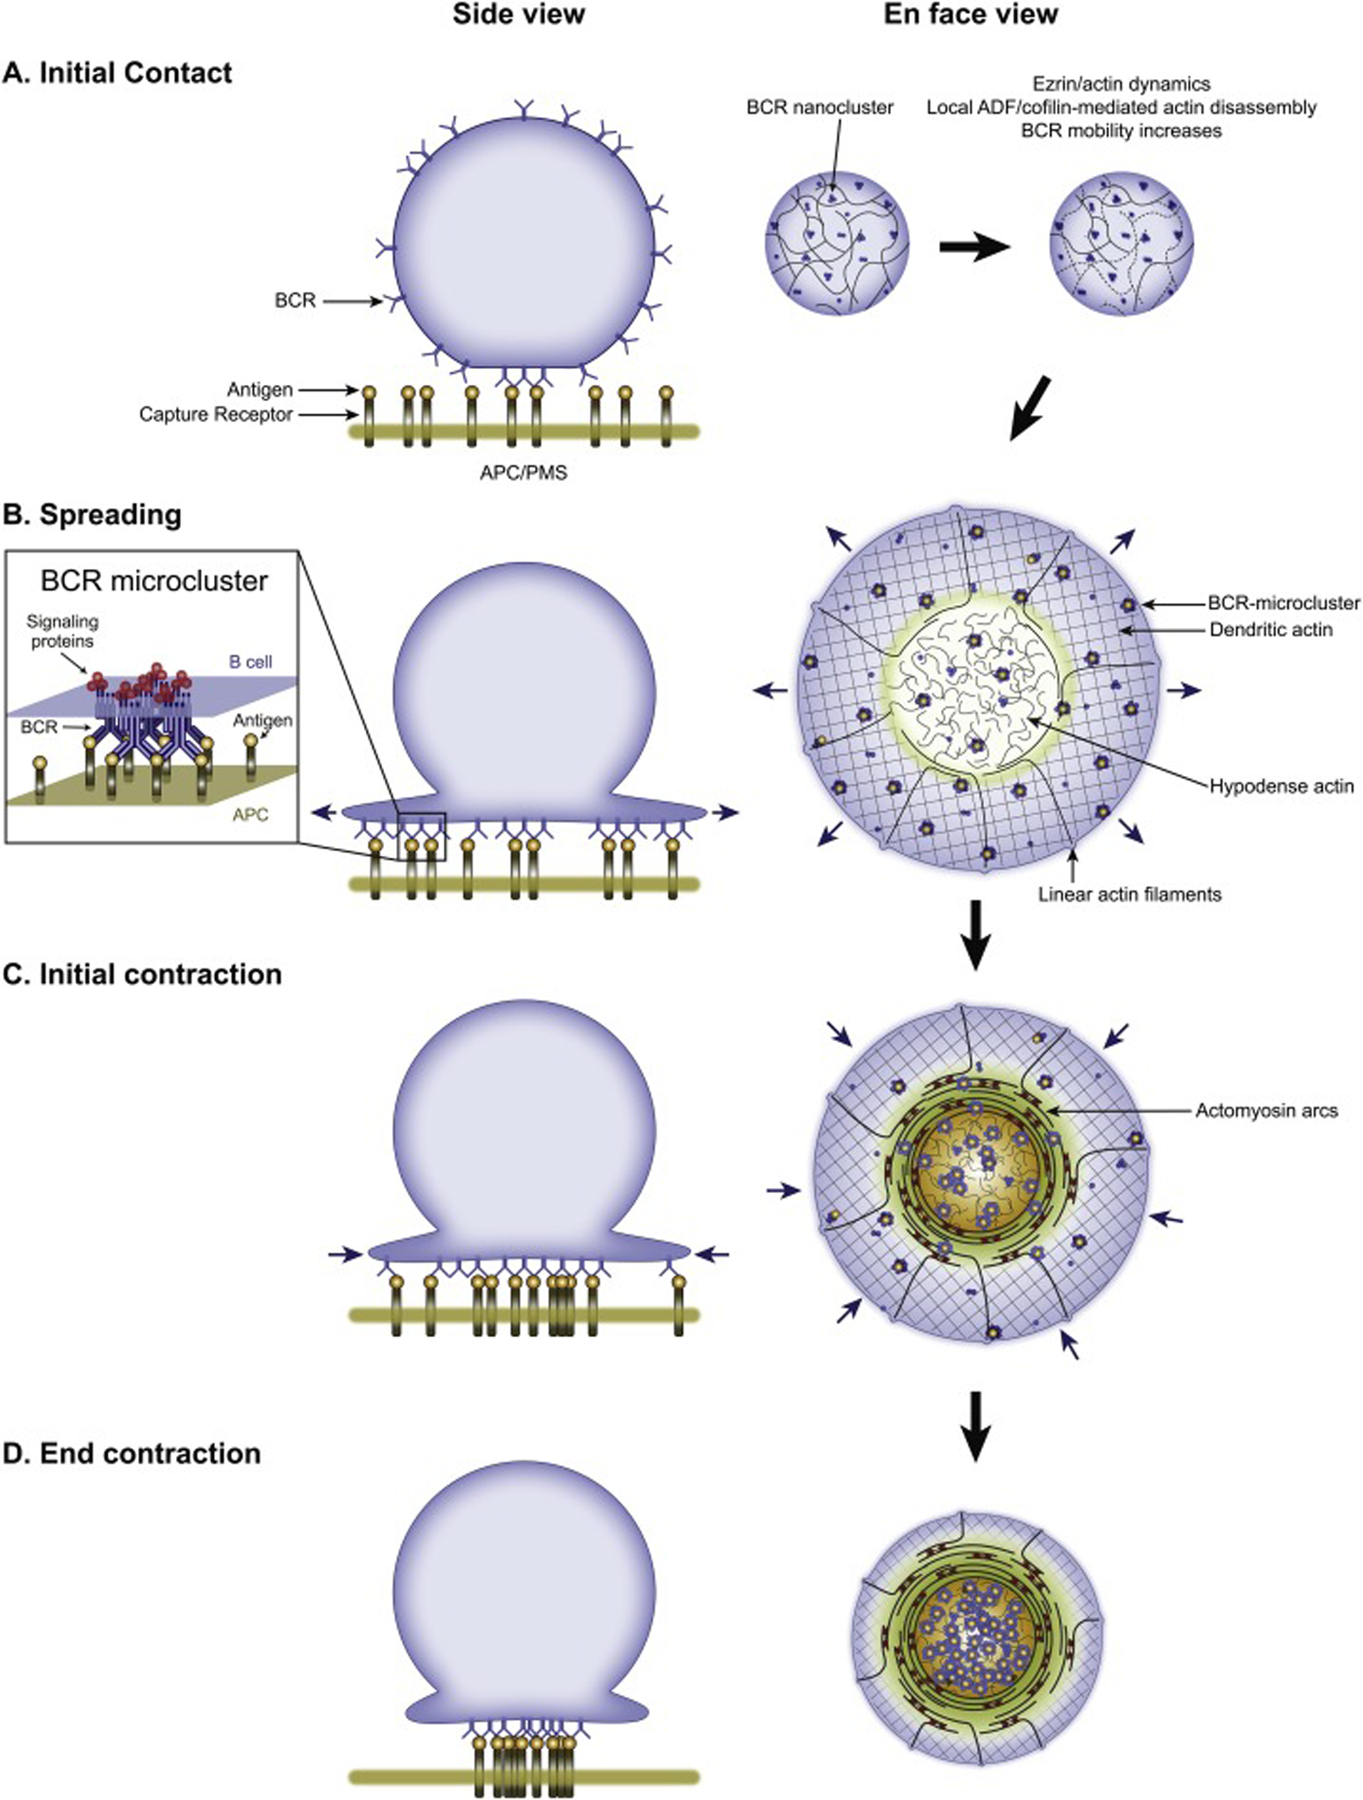
Figure 3.

B cell events leading up to antigen extraction. Shown on the left are cartoons depicting the initial contact of the B cell with the APC/activating surface (A), the spreading of the B cell over this surface (B), and the subsequent contraction phase divided into initial contraction (C) and the end of contraction (D). The inset in (B) depicts an antigen-bound BCR microcluster (MC) with associated signaling molecules. On the right are cartoons depicting the organization and dynamics (blue arrows) of the B cell synaptic actin and actomyosin networks described in Figure 2 during these four phases. Please note that these latter cartoons are largely conjecture at this point (especially the possible role of the actomyosin arcs in the pSMAC portion of the B cell synapse in driving the contraction phase). Also of note, one study implicated the dynein-dependent movement of BCR MCs on microtubules in the BCR centralization process [124]. Finally, we note that while the steps shown in this figure and discussed in the corresponding text are presented for the sake of clarity as if they are always completely sequential and very well defined both temporally and spatially, in reality they often blend together to some extent due to variations in the kinetics of their formation and their spatial distribution. PMS, plasma membrane sheet; ADF, actin depolymerizing factor.
