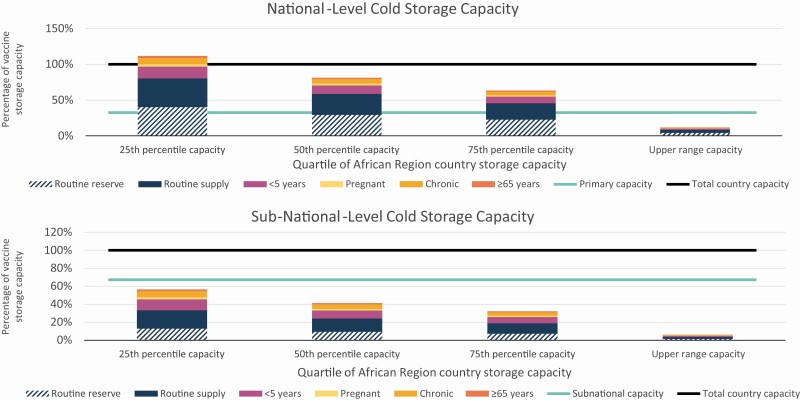
Figure 4.
Maximum national-level and subnational-level monthly routine and influenza vaccine volumes as a proportion of total country storage capacity, by quartile of African Region country storage capacity. Vaccines are distributed according to a vaccine flow-down schema (Figure 1).These analyses used the month from the schema with the highest storage volume for national and subnational levels. Cold storage capacity data were accessed as volume per population of children two years and younger, with values for 25th percentile, 50th percentile, 75th percentile, and upper range. These analyses applied the standardized capacities to the country population.

