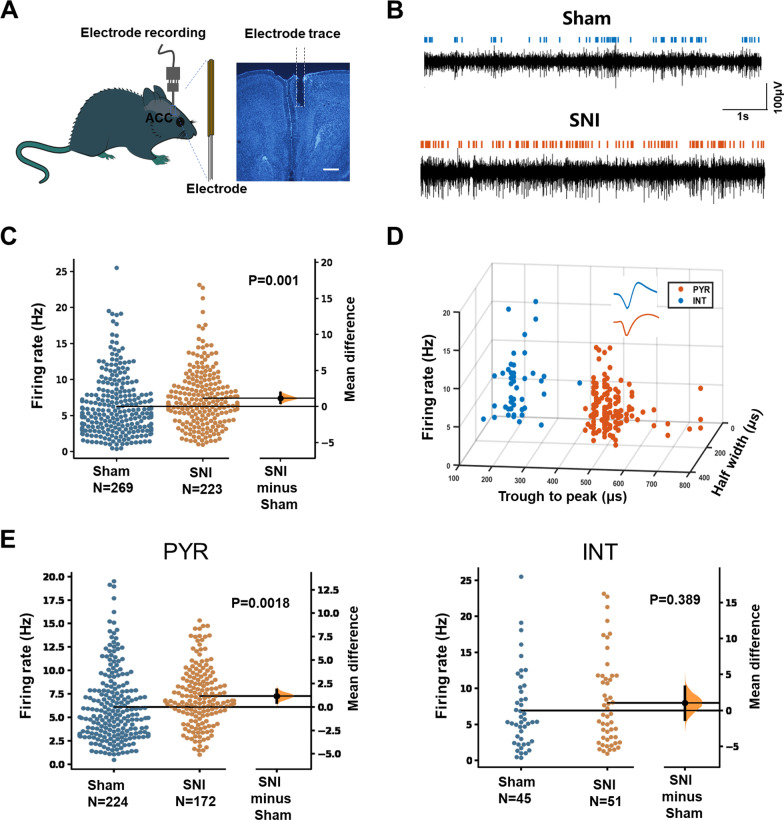
Fig. 3.
The increased firing rate of pyramidal cells in the ACC of SNI mice. A Schematic showing the single-unit recording of ACC in awake mice using in vivo multi-channel recording technique. One example image on the right panel showing the electrodes trace in the ACC. Scale bar = 500 μm. B Example recording signals of ACC neurons. The blue or orange lines indicate the spikes in one sham-operated or one SNI mouse, respectively. C The firing rates of neurons in sham and SNI groups are plotted by using the Gardner-Altman estimation method [31]. Both groups are plotted on the left axes; the mean difference is plotted on the floating axes on the right as a bootstrap sampling distribution. The mean difference is depicted as a dot and the 95% confidence interval is indicated by the ends of the vertical error bar. p = 0.001 (n = 3 mice in sham and SNI group, paired t-test). D Partial recorded ACC neurons (n = 194) were classified as pyramidal cells (149) and interneurons (45) using k-means cluster-separation algorithm based on their electrophysiological properties. Each dot represents one cell. Inset, the average waveform of a representative pyramidal cell (PYR, red) and interneuron (INT, blue). E The firing rates of pyramidal cells (p = 0.0018) and interneurons (p = 0.389) in sham and SNI groups (paired t-test). PYR pyramidal cells; INT interneurons

