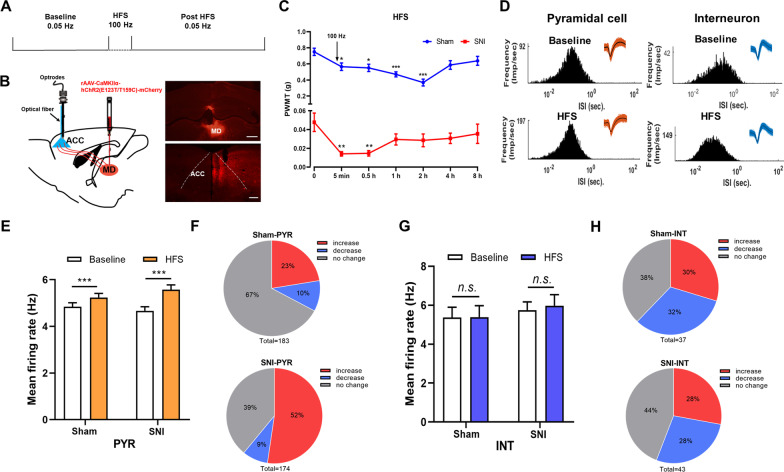
Fig. 4.
Optical HFS induction of ACC afferent fibers increases the activities of ACC pyramidal cells and induces pain hypersensitivity. A Experimental timeline. B Schematic showing that, with the injection of rAAV-CaMKIIα-ChR2 (E123T/T159C)-mCherry into the ipsilateral mediodorsal thalamic nucleus (MD), an optic fiber was implanted into the ACC through the multi-channel recording system and the in vivo spikes of ACC neurons are recorded. The coronal sections of virus injection site in the MD and mCherry+ projecting fibers in the ACC are shown on the right panel. Scale bars = 500 μm. C PWMT before (0 h) and after oHFS induction in sham and SNI mice. *p < 0.05; **p < 0.01; ***p < 0.001, compared with baseline (0 h) (n = 8 mice in each group, One Way ANOVA with Dunnett post hoc analysis). D Histograms of the inter-spike intervals (ISI) from the spikes of a pyramidal cell and an interneuron in baseline and post-HFS recording period. Insets at the top right corner show the waveforms of the detected single unit. E The averaged firing rate of pyramidal cells (PYR) in sham and SNI group before and after oHFS induction. ***p < 0.001, n = 3 mice in sham and SNI group, paired t-test. F Proportion of pyramidal cells with changed firing rate in sham and SNI groups. Pie charts summarize the changes in firing rate of pyramidal cells in sham (n = 183 neurons) or SNI (n = 174 neurons) groups. Pre vs. post oHFS induction, Wilcoxon rank-sum test. G The averaged firing rate of interneurons (INT) in sham and SNI group before and after oHFS induction. n.s. not significant, n = 3 mice in sham and SNI group, paired t-test. H Proportion of interneurons with changed firing rate in sham and SNI groups. Pie charts summarize the changes in firing rate of interneurons in sham (n = 37 neurons) or SNI (n = 43 neurons) groups. Pre vs. post oHFS induction, Wilcoxon rank-sum test

