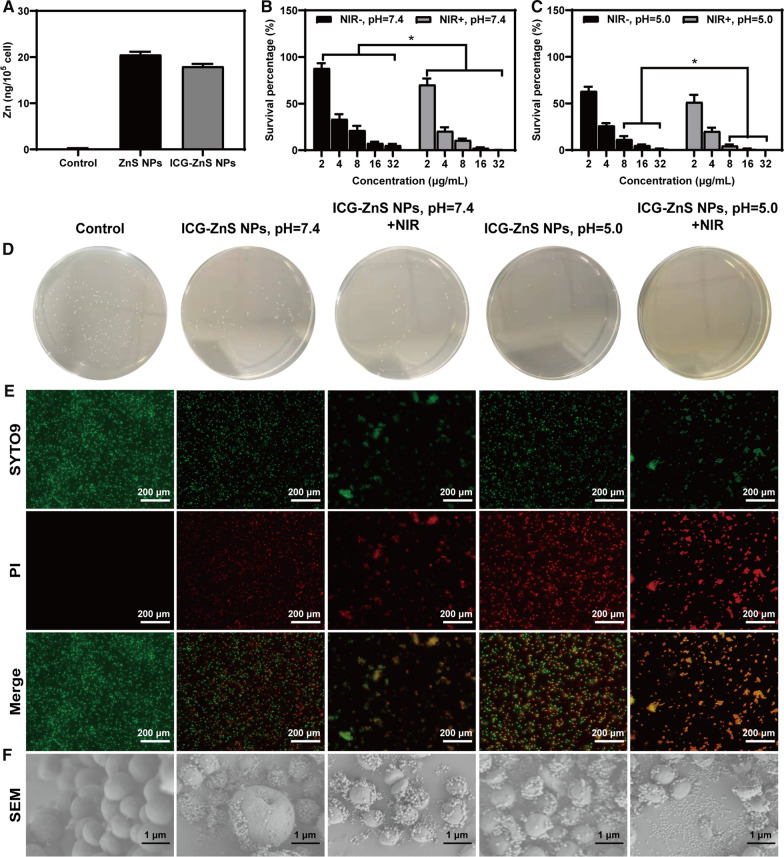
Fig. 4.
In vitro evaluation of anti-bacterial activity. A Intracellular Zn amounts were determined by ICP-MS. B, C Bacterial survival efficiency treated by the ICG-ZnS NPs and ICG-ZnS NPs + NIR at different concentrations at pH 7.4 and 5.0. D Representative plates of MRSA colonies after treatment with ICG-ZnS NPs and ICG-ZnS NPs + NIR (8 µg·mL−1) at different concentrations at pH 7.4 and 5.0 (scale bar: 200 μm). E Live/dead staining images of MRSA. F SEM images of MRSA after different treatments (scale bar: 1 μm). Data are presented as the means ± SD (n = 3), *P < 0.05, **P < 0.01

