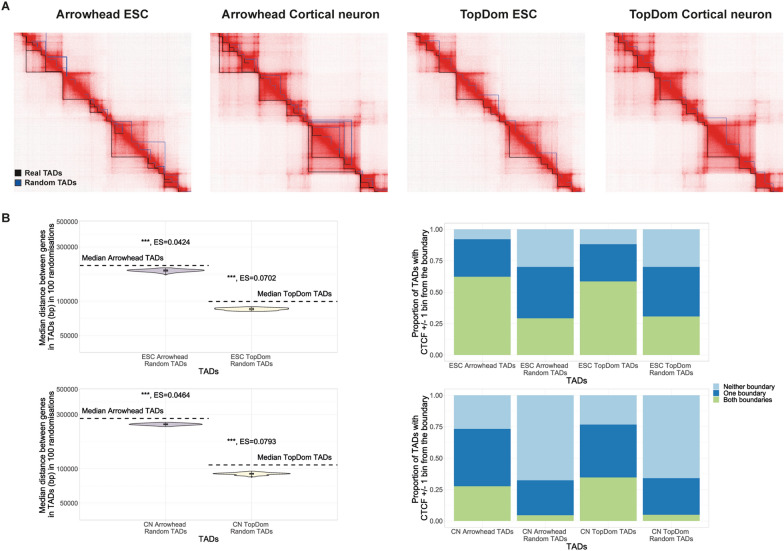
Fig. 3.
Features of autosomal TADs vs random TADs. A TADs (black) vs an example set of random TADs (blue) shown on the Hi-C matrix for the equivalent region of Chr2 in both ESCs and cortical neurons (CN). Matrices visualised using JuiceBox. B Median distance between gene start coordinates in TADs (dotted line) vs the median distance between genes in 100 sets of random TADs (plotted on a log10 scale). Genes are significantly closer together in random TADs than TADs (Wilcoxon test, median p-value: p < 0.001 = ***, p < 0.01 = **, p < 0.05 = *, ES = median effect size calculated using r for Wilcoxon). C Proportion of TADs with a CTCF binding site within ± 10 kb of both boundaries, one boundary or neither boundary. As expected a greater proportion of TADs have a CTCF binding site near both boundaries than in an example set of random TADs

