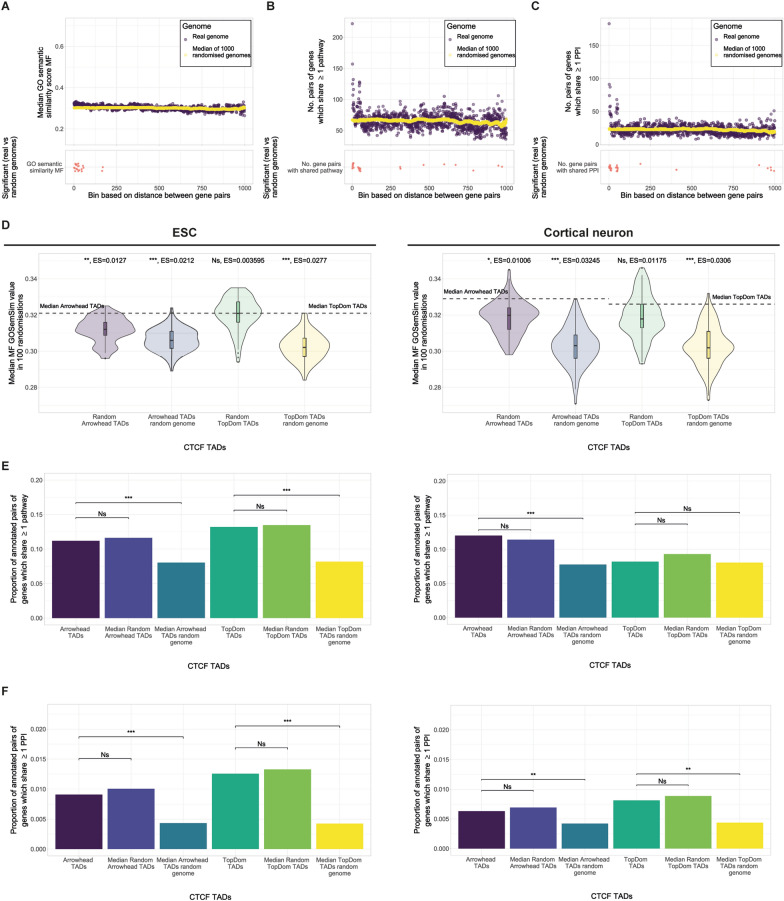
Fig. 6.
Functional similarity of pairs of genes in autosomal CTCF TADs. Olfactory genes and paralogous gene pairs have been excluded in all panels. A–C Top panel: median GO semantic similarity, number of gene pairs with ≥ 1 shared pathways or number of gene pairs with ≥ 1 shared PPI for pairs of genes vs binned distance in the genome and 1000 random genomes. Bottom panel: stars indicate bins with a significantly higher functional similarity in the genome vs 1000 random genomes (FDR corrected p-value < 0.05). D–F TADs called using both Arrowhead and TopDom; in both ESC and cortical neuron Hi-C. Median p-value: p < 0.001 = ***, p < 0.01 = **, p < 0.05 = *, NS = not significant. A Distribution of MF GO semantic similarity for pairs of genes binned by distance in the genome vs 1000 random genomes. B Distribution of the number of pairs of genes sharing ≥ 1 pathway binned by distance in the genome vs 1000 random genomes. C Distribution of the number of pairs of genes sharing ≥ 1 PPI binned by distance in the genome vs 1000 random genomes. D Median MF GO semantic similarity for pairs of genes in CTCF TADs (dotted line) compared to the distributions of median MF semantic similarity for 100 sets each of: random CTCF TADs and random genome CTCF TADs (Wilcoxon test, median p-value, median ES = effect size calculated using r for Wilcoxon). E Proportion of annotated pairs of genes sharing ≥ 1 pathway in CTCF TADs and the median proportion of pairs of genes sharing ≥ 1 pathway in 100 sets each of: random CTCF TADs and random genome CTCF TADs (Fisher’s exact test, median p-value). F Proportion of annotated pairs of genes sharing ≥ 1 PPI in CTCF TADs and the median proportion of pairs of genes sharing ≥ 1 PPI in 100 sets each of: random CTCF TADs and random genome CTCF TADs (Fisher’s exact test, median p-value)

