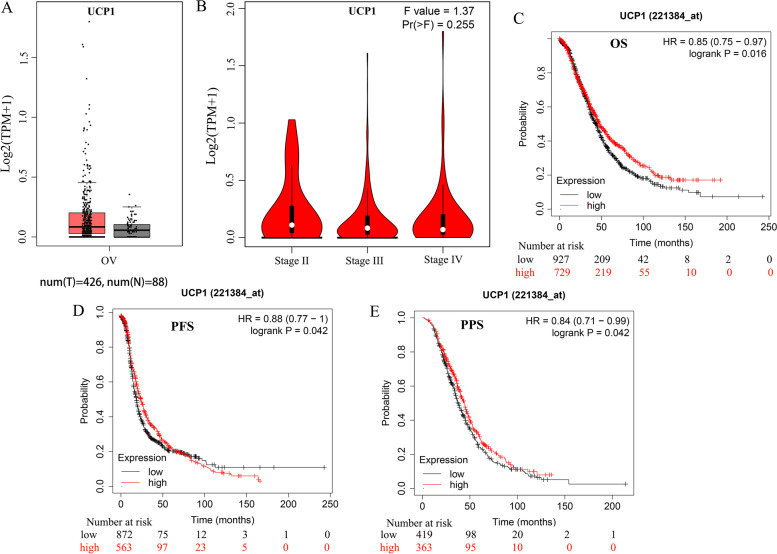
Fig. 1.
Transcriptional expression level and prognosis value of UCP1 in ovarian cancer. A UCP1 transcriptional expression levels in ovarian cancer compared with normal tissues in GEPIA database. B UCP1 expression in different stages of ovarian cancer. C OS curves of UCP1. High UCP1 expression levels correlated with better OS in OV (p = 0.016). D PFS curves of UCP1. High UCP1 expression levels correlated with better PFS in OV (p = 0.042). E PPS curves of UCP1. High UCP1 expression levels correlated with better PPS in OV (p = 0.042). (OS: overall survival; RFS: recurrence-free survival; PPS post-progression survival). F-values represent one- way ANOVA

