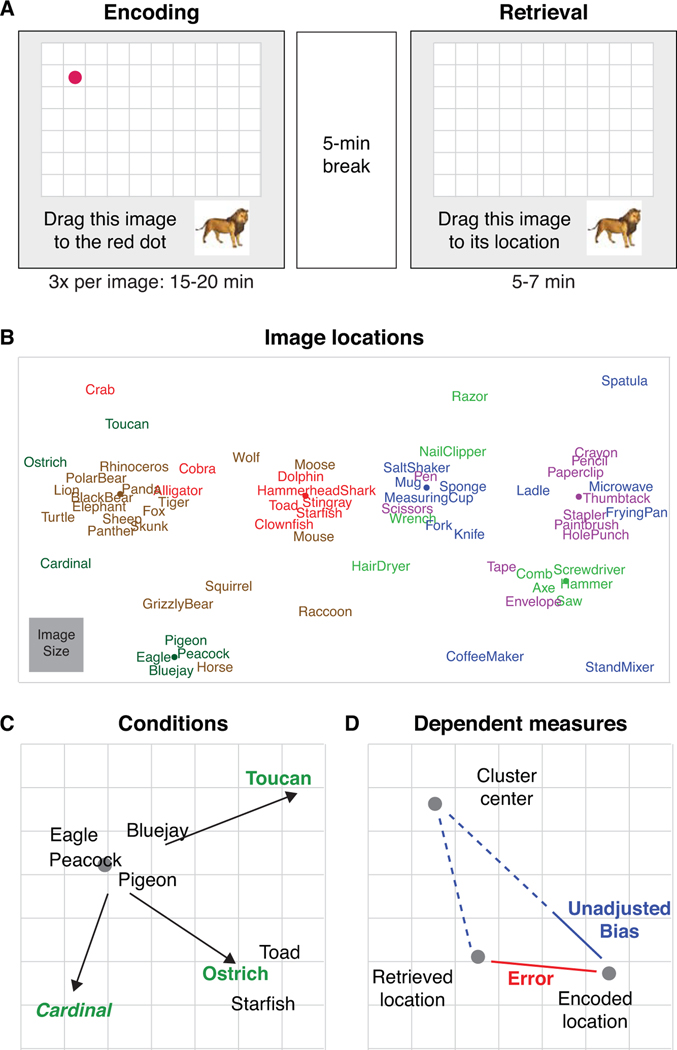
Figure 1. Experiment 1 design.
(A) Experiment 1 procedure. Participants encoded each image-location three times by dragging the image onto a red dot marking its location. After a 5-minute break, participants retrieved the location of each image. (B) Image locations in the experimental group. In the control group, images were randomly assigned to the locations within each superordinate category (right and left side of the screen) such that they were no longer clustered by basic-level category. (C) Spatial consistency and category typicality for the ‘bird’ category. Black indicates spatially ‘consistent’ and green/bold font indicates spatially ‘inconsistent’ images. All inconsistent images were either typical (italicized) or atypical (not italicized) category members. Gray dot indicates the center of all spatially consistent images in a category. (D) Example of retrieval measures for an image biased towards its category’s cluster center. Solid red line indicates error. Solid blue line indicates unadjusted bias. Bias is quantified as an image’s unadjusted bias as a proportion of error (solid blue line divided by red line).

