Figure 2.
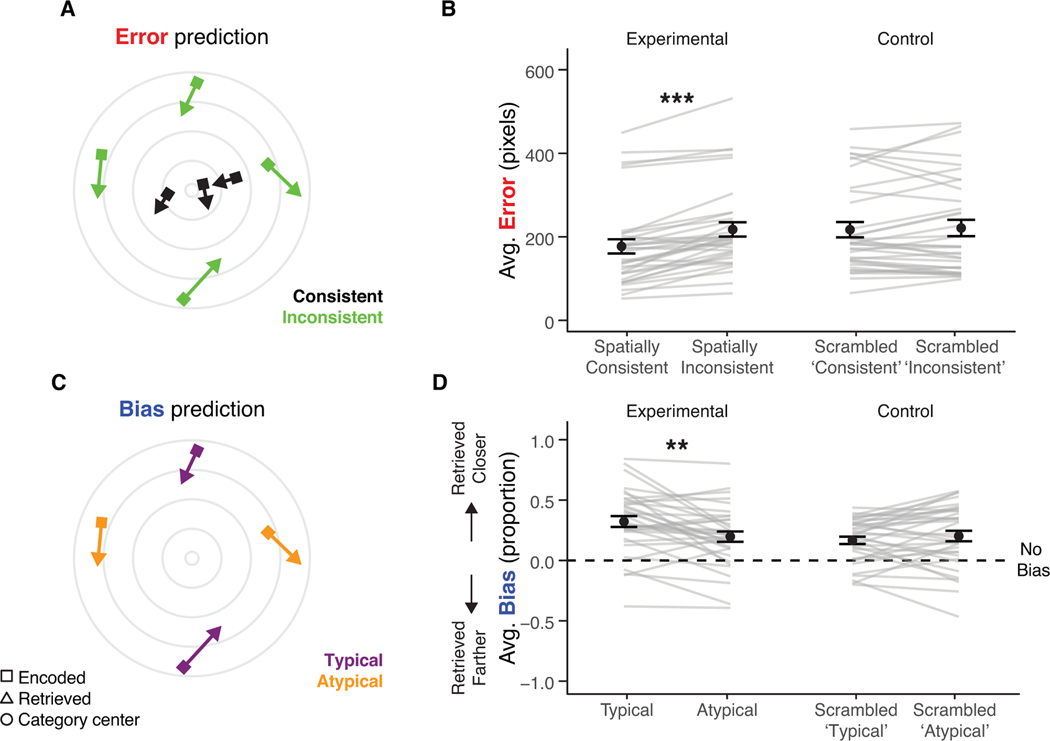
Experiment 1 (A) We predicted that images whose locations were spatially consistent with their category (e.g. located near other category members) would be remembered more accurately than images in random locations. Gray circle indicates the center of a category cluster. Arrows indicate the encoded and retrieved locations of images from that category. Shorter arrows signify more accurate memory. Note that ‘spatially inconsistent’ locations comprise the 20% most typical and 20% most atypical category members, while ‘spatially consistent’ locations comprise images of intermediate typicality. (B) Average error as a function of spatial consistency, where greater values indicate larger errors in location memory. Scrambled ‘consistent’ and ‘inconsistent’ conditions in the control group indicate error for images that were randomly assigned to the spatially consistent and inconsistent locations in the experimental group. (C) Of all spatially inconsistent images, we predicted that typical category members would be retrieved closer to their category center relative to atypical members. (D) Average bias by category typicality and group, where > 0 indicates retrieval closer to the category center than originally encoded and < 0 indicates retrieval away. (B, D) Scrambled ‘typical’ and ‘atypical’ conditions in the control group indicate images randomly assigned to the locations of typical and atypical category members in the experimental group. Gray lines indicate participants. Error bars indicate standard error of the mean (SEM) across participants. ** p < .01; *** p < .001.

