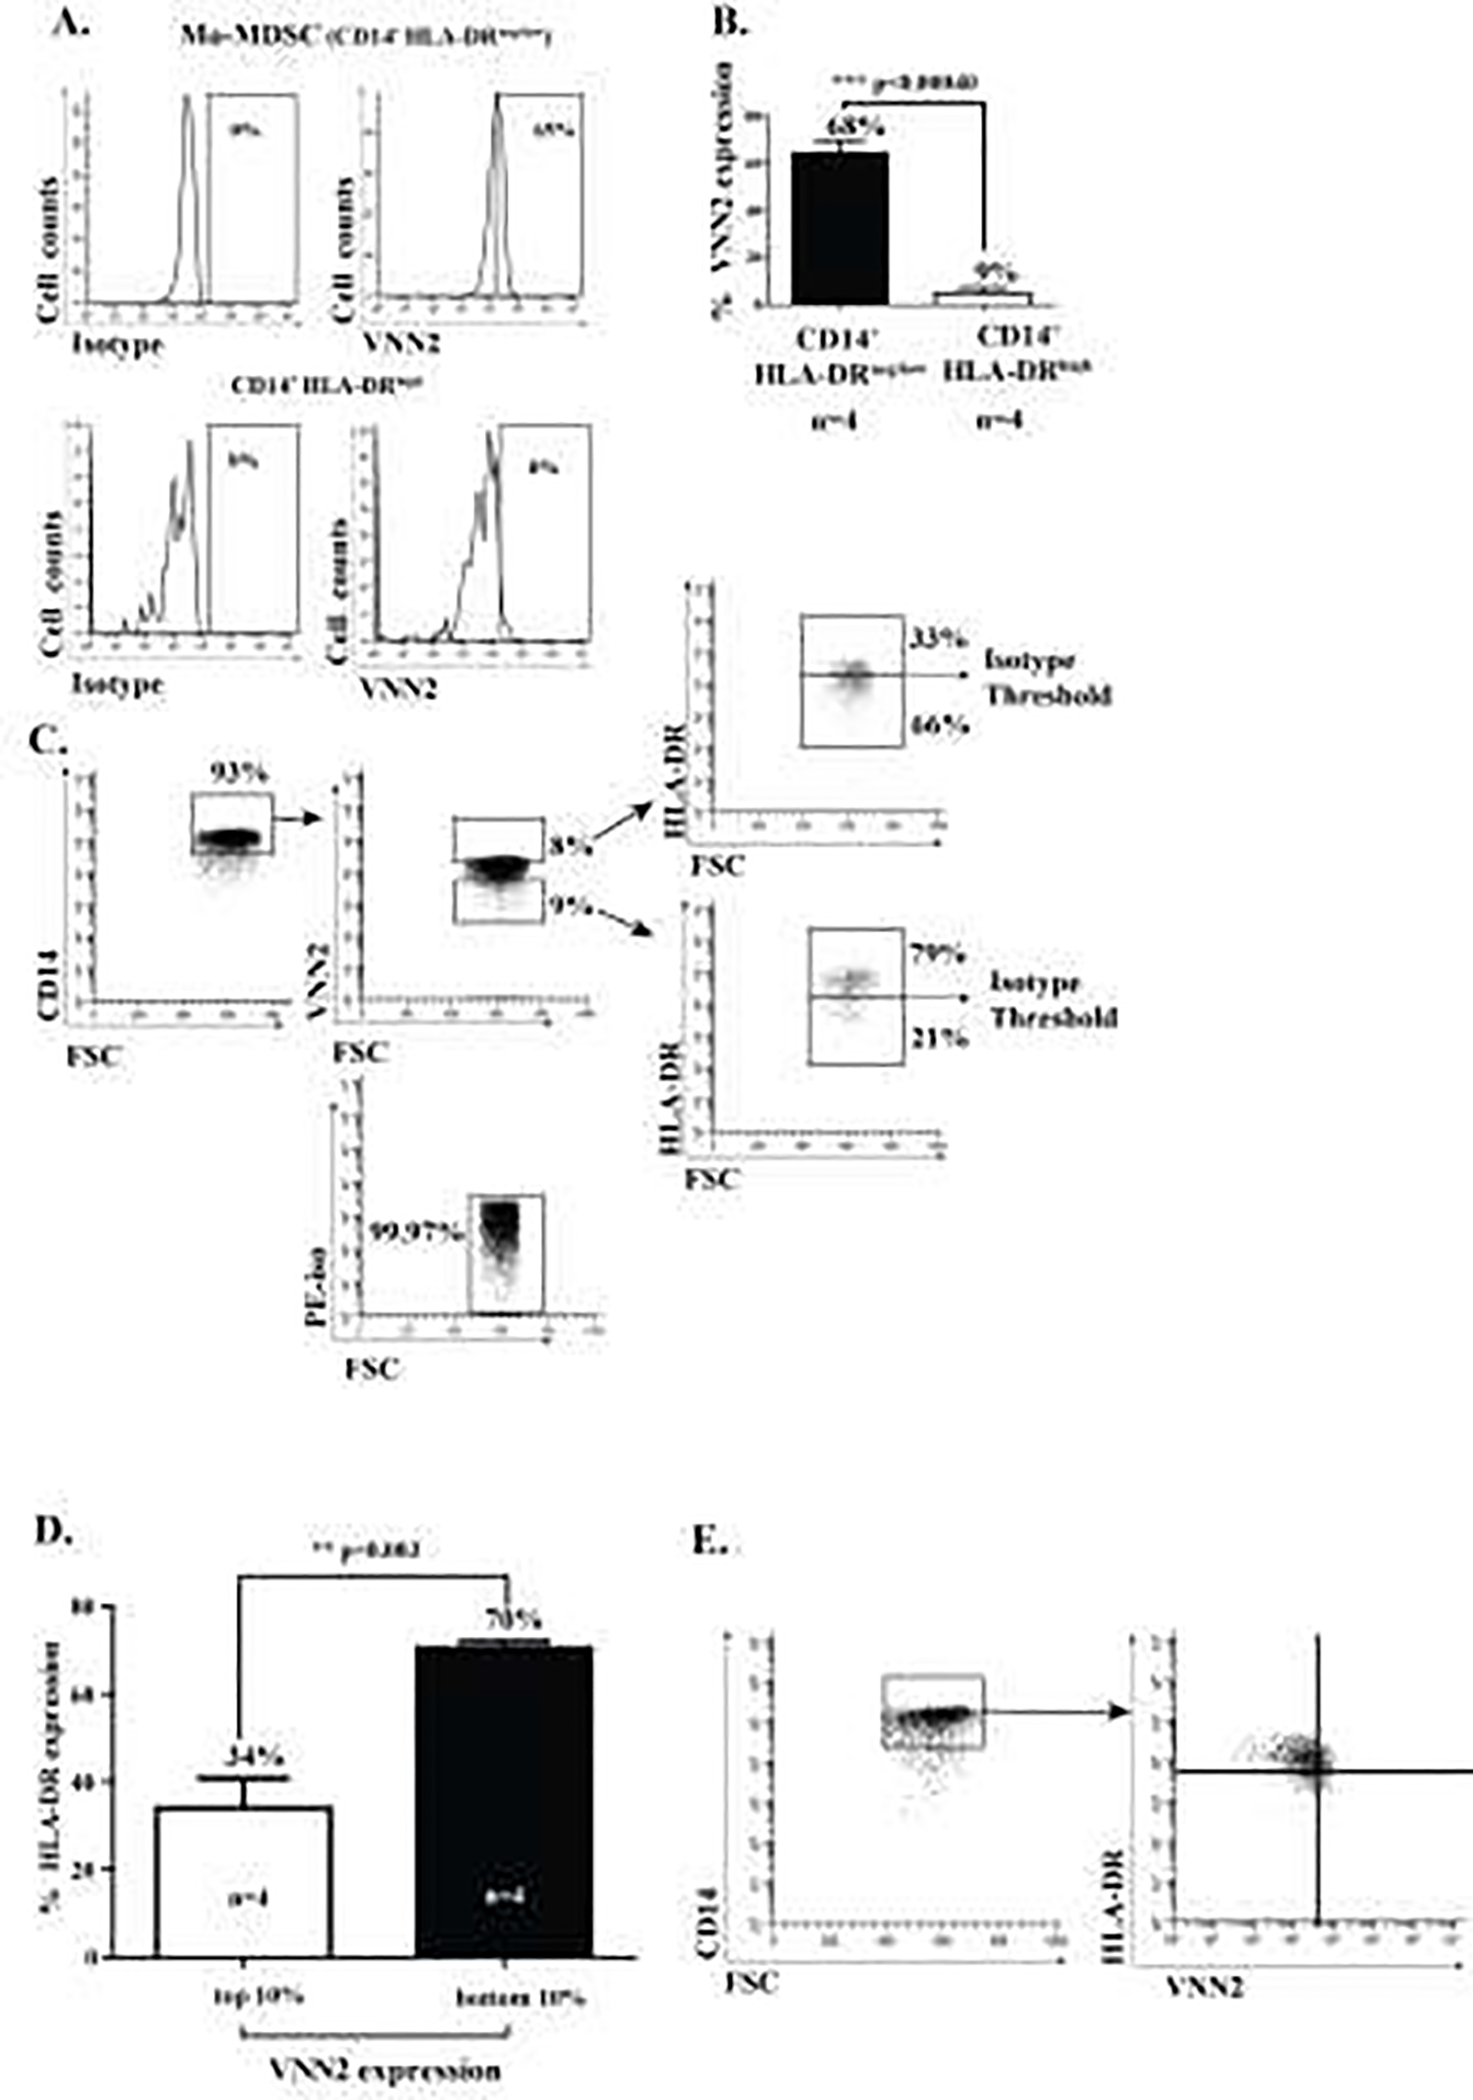
Figure 3. Monocytic-MDSCs expressing CD14+ HLA-DRneg/low also express high levels of surface VNN2.

A) A representative flow cytometry diagram demonstrating 65% VNN2 expression on Mo-MDSCs compared to 8% expression on CD14+ HLA-DRhigh cells (top 10%), relative to their respective isotype controls. B) VNN2 protein expression on Mo-MDSC compared to CD14+ HLA-DRhigh cells (68% vs. 9%, n=4 each, p<0.0004). C) Characteristic cytometry plot demonstrating (CD14+)VNN2high cells express relatively little HLA-DR compared to HLA-DR expression among (CD14+) VNN2low cells. D) Mean HLA-DR expression among the top (10%)-expressing VNN2 cells versus the bottom (10%) of VNN2-expressing cells. E) Representative individual scatter grams of VNN2 and HLA-DR on CD14+ monocytes.
