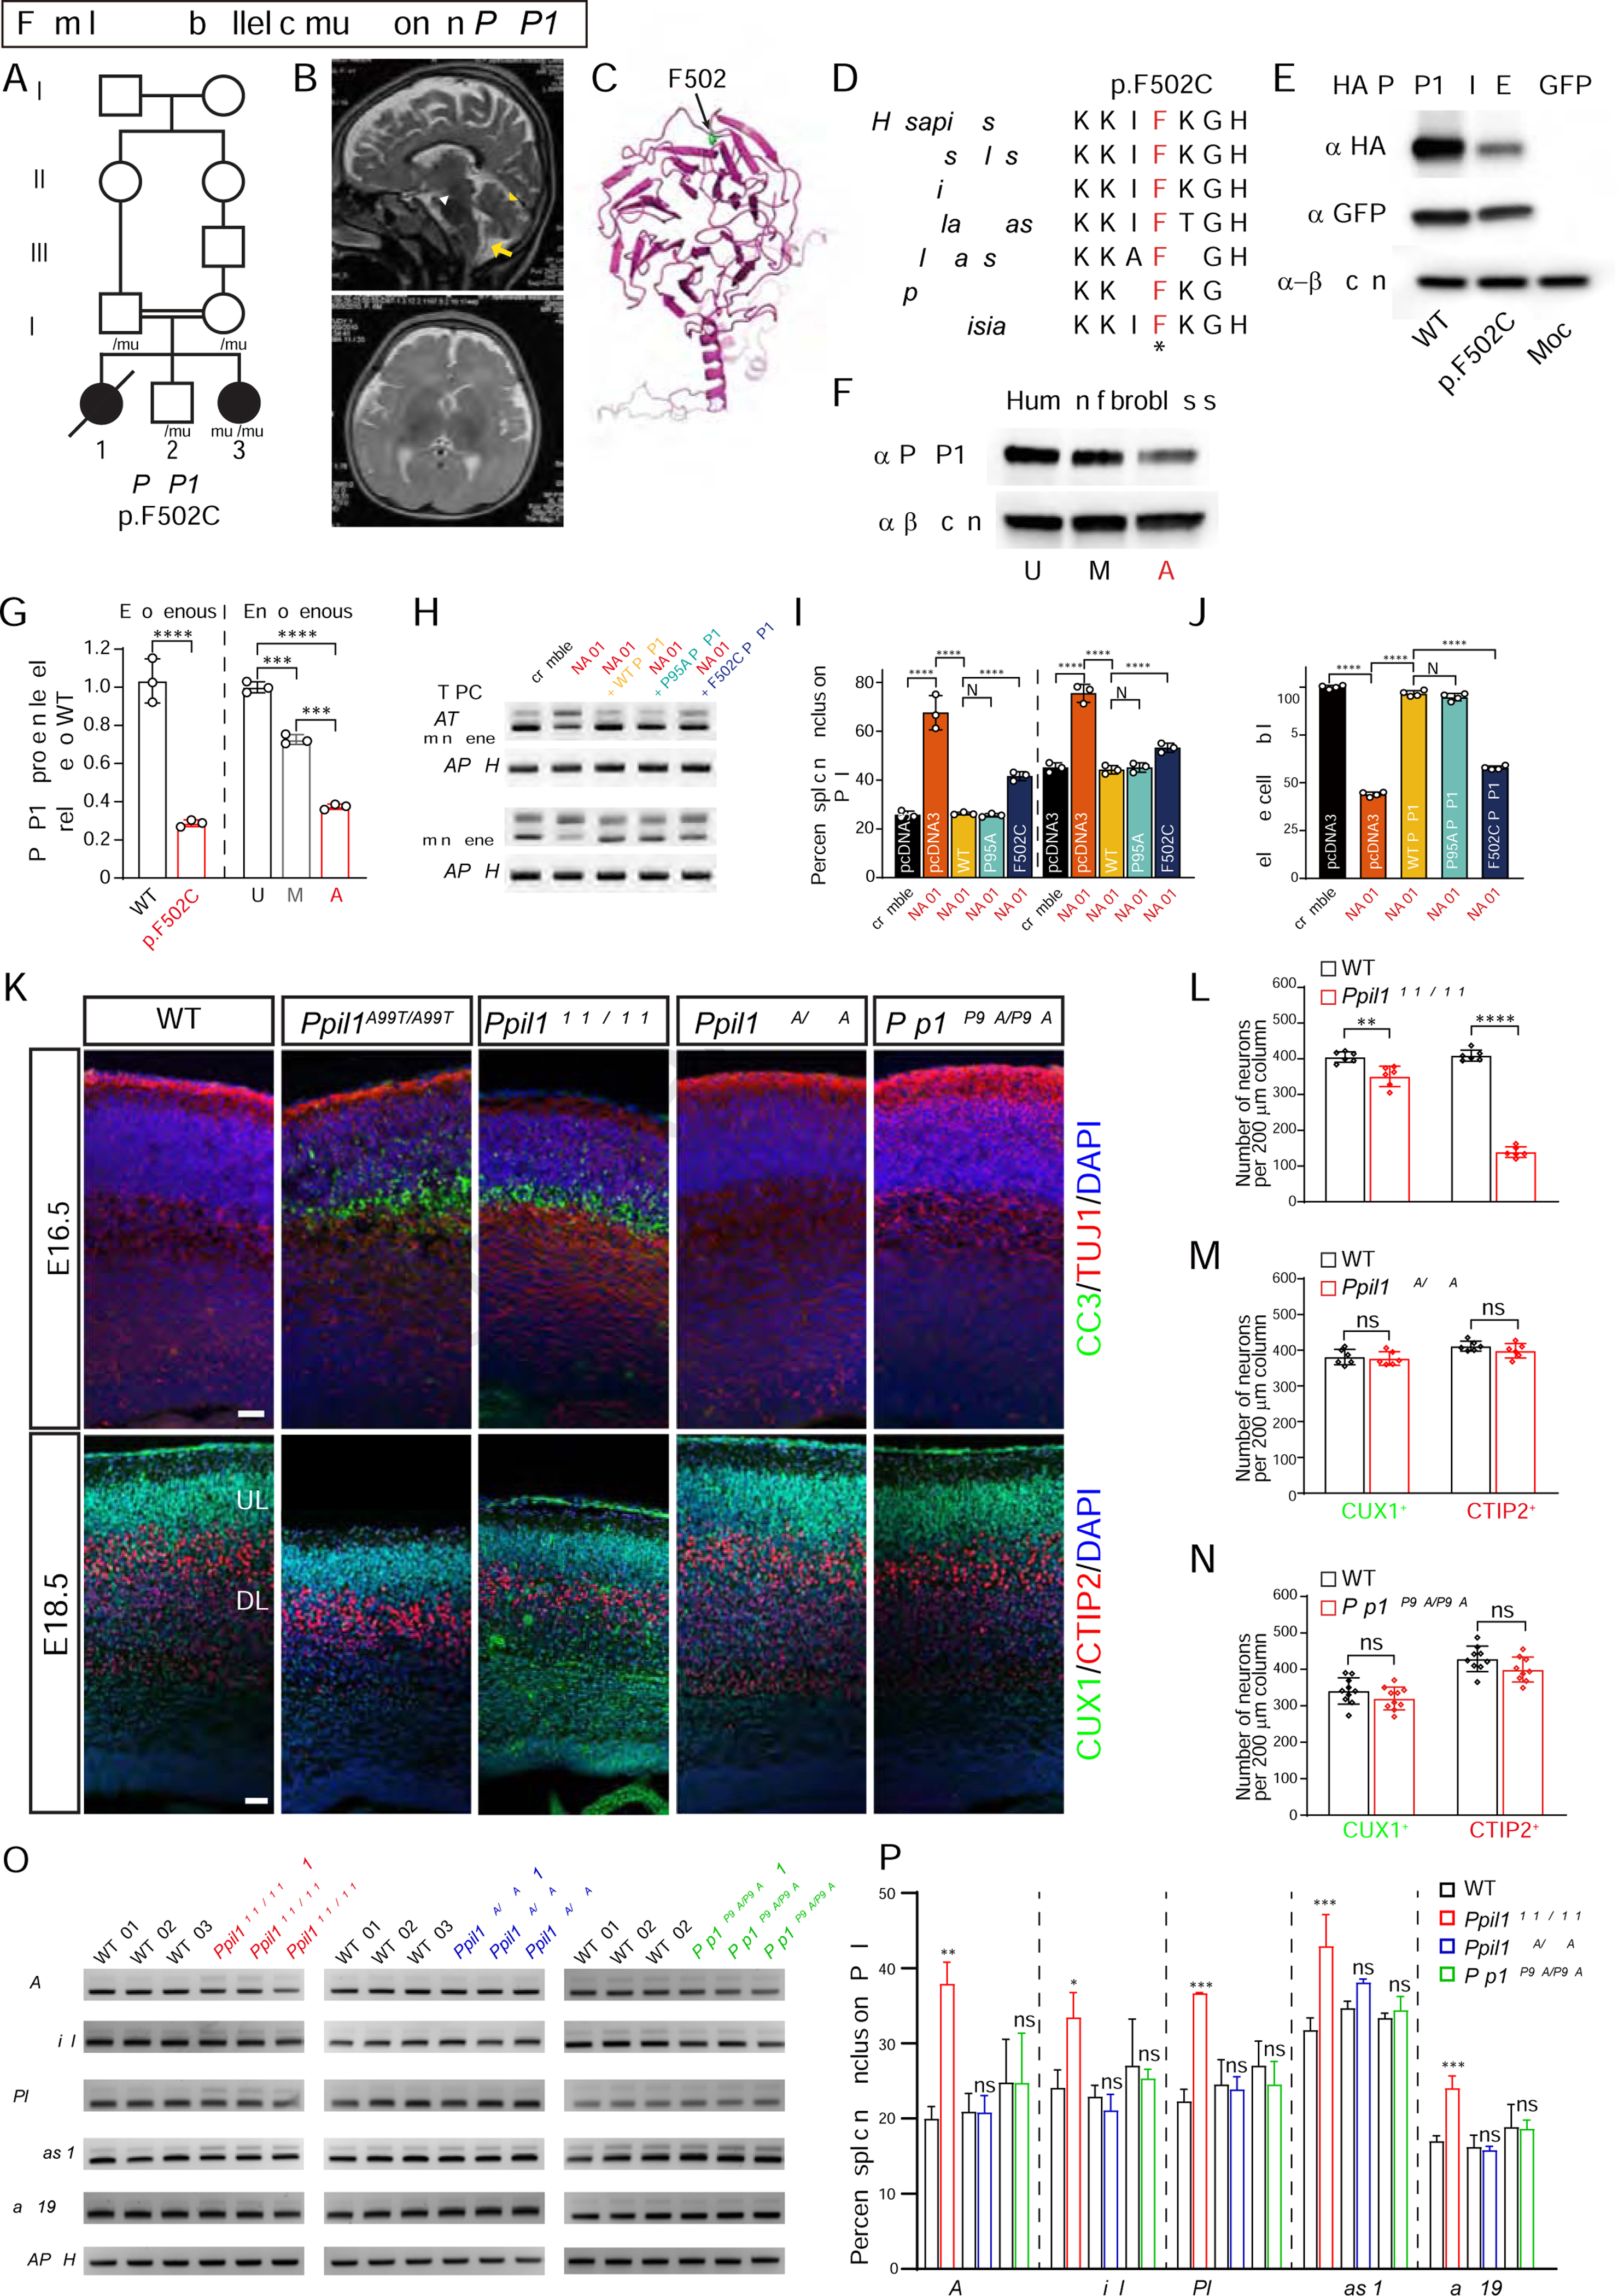
Figure 6. PPIL1 and PRP17 control neuronal survival independent of catalysis.

(A) Pedigrees of PCHM Family 10 with homozygous PRP17 p.F502C variant segregating as a recessive trait. Filled symbols: affected; square: male; circle: female; double bar: consanguinity; diagonal line: deceased.
(B) T2-weighted brain MRI shows reduced cerebellar volume (yellow arrowhead), atrophic pons (white arrowhead) and posterior fossa fluid accumulation (yellow arrows) indicative of cerebellar atrophy in the living affected.
(C) The structure of PRP17 resolved from the cryo-EM structure of spliceosomal C complex (PDB: 5XJC) showing mutated residue F502 within the C-terminal WD40 domain.
(D) Protein sequence alignment of PRP17 showing mutated F502 residue highly conserved across eukaryotes. *: identical.
(E) Western blot of overexpressed HA-tagged PRP17 shows that the p.F502C substitution destabilized the protein.
(F) Western blot of endogenous PRP17 from dermal fibroblasts demonstrating reduced protein levels from affected (A) compared with mother (M) and unaffected control (U).
(G) Quantification of exogenous and endogenous PRP17 protein in transfected HEK293T cells and human dermal fibroblasts, respectively. n = 3.
(H) RT-PCR based minigene splicing assay following PRP17 repression in HEK293T cells, showing full rescue by WT or p.P95A PRP17 but only partial rescue by p.F502C PRP17.
(I) Quantification of percent splicing inclusion (PSI) for minigene splicing reporters. PSI was calculated as percent of inclusion form transcripts among all transcripts (inclusion and exclusion forms). n = 3.
(J) Reduced cell viability following PRP17 repression was fully rescued by WT or p.P95A PRP17 but only partially by p.F502C PRP17. n = 4.
(K) Coronal sections of E16.5 (top) and E18.5 (bottom) mouse brains with upregulated cleaved caspase 3 (CC3) and reduced cortical thickness in Ppil1A99T/A99T and Ppil1R131Q/R131Q, but not in Ppil1R55A/R55A or Prp17P95A/P95A. CUX1 and CTIP2 label upper and deep layer cortical neurons, respectively. Scale bar: 50 μm.
(L–N) Quantification of cortical CUX1+ and CTIP2+ neurons in E18.5 cortex of Ppil1R131Q/R131Q (L), Ppil1R55A/R55A (M), Prp17P95A/P95A (N), and littermate controls. n = 3 mice/genotype.
(O) Semi-quantitative RT-PCR analysis of significant RI events in Ppil1A99T/A99T among E14.5 brains of Ppil1R131Q/R131Q (red), Ppil1R55A/R55A (blue), Prp17P95A/P95A (green), and littermate controls. GAPDH as loading control.
(P) Quantification of percent splicing inclusion (PSI) for RI events. n = 3 for each genotype.
Mean ± s.d.; p-value: ns > 0.05; * <0.05; ** <0.005; *** <0.001; **** <0.0001; one-way ANOVA test for all panels.
See also Figure S7.
