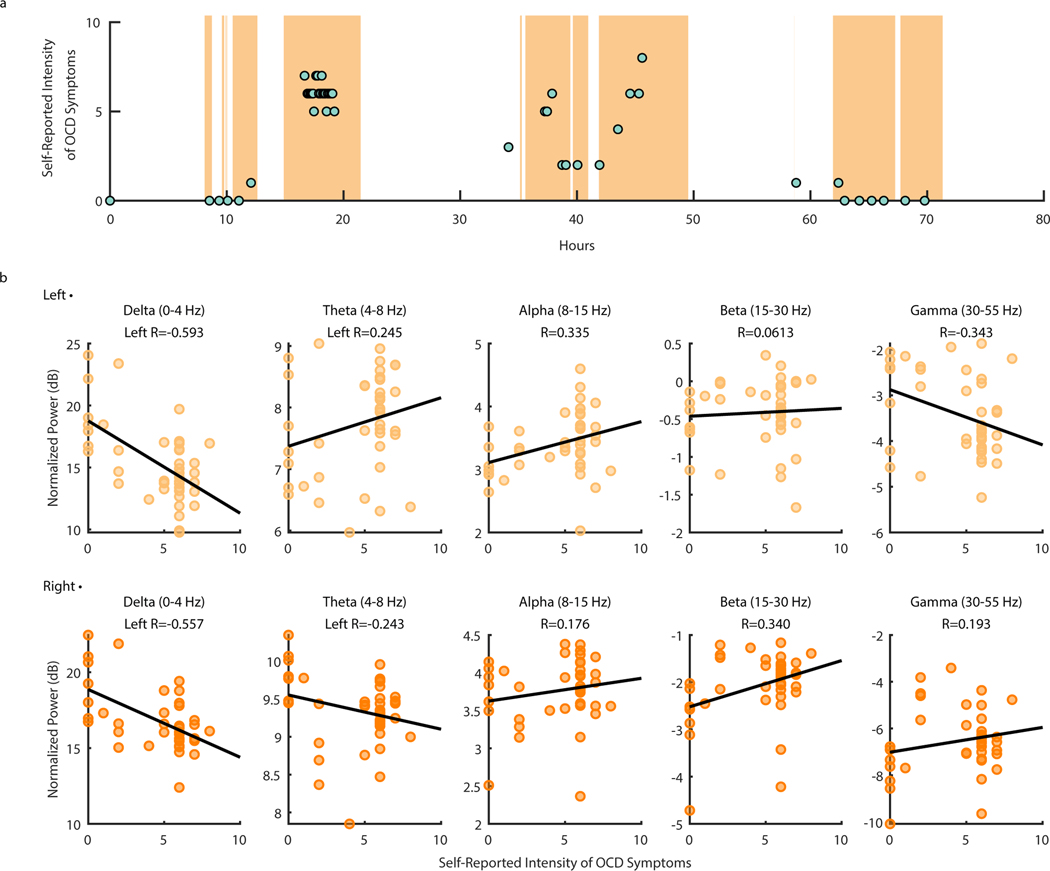
Figure 6: Ventral Capsule/Ventral Striatum spectral power shows correlations with OCD symptom intensity during P4 natural exposures at home.
(A) Self-reported intensity of OCD symptoms (scatter points) shown over time in hours with LFP data availability (orange shading). (B) Normalized left (top row) and right (bottom row) VC/VS spectral power in Delta (0–4 Hz), Theta (4–8 Hz), Alpha (8–15 Hz), Beta (15–30 Hz), and Gamma (30–55 Hz) (from left to right) vs. self-reported OCD symptom intensity from zero to 10. Black lines represent the line of least squares. R values correspond to the coefficient of correlation.

