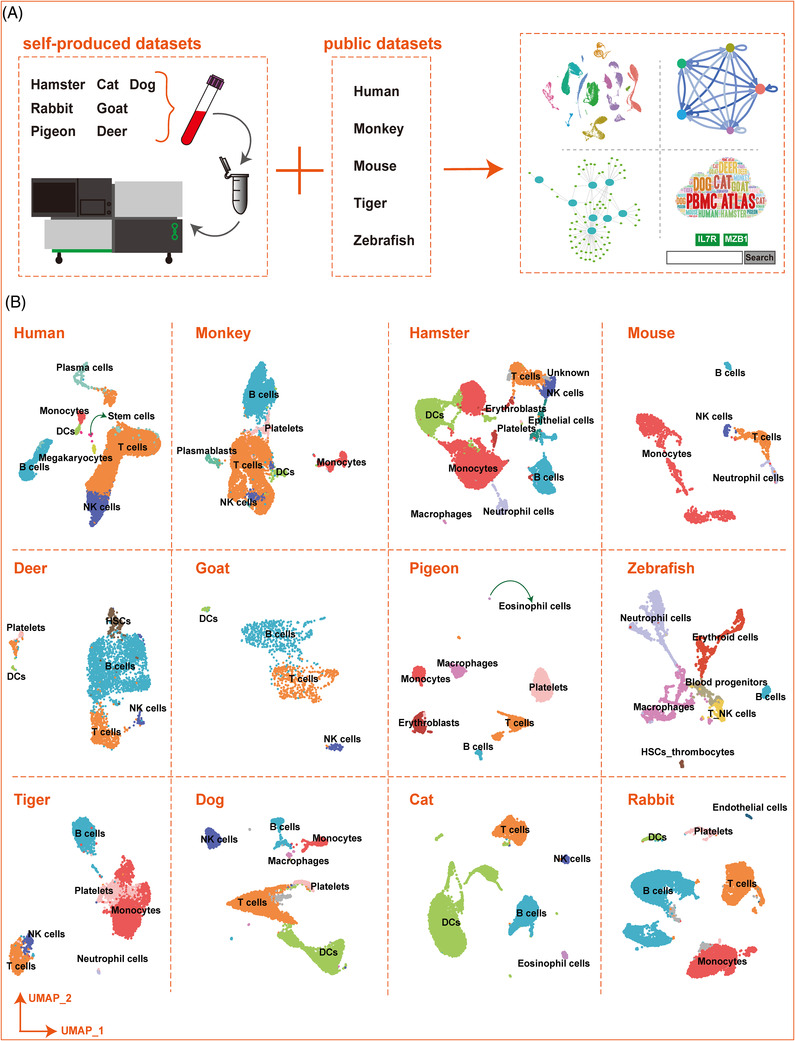
FIGURE 1.

Single‐cell transcriptome atlas of PBMCs for 12 species. (A) Illustration of the overall project design. (B) UMAP plots showing single cell transcriptome atlas of 12 species. Dots with colours represent different cell types which were indicated above
