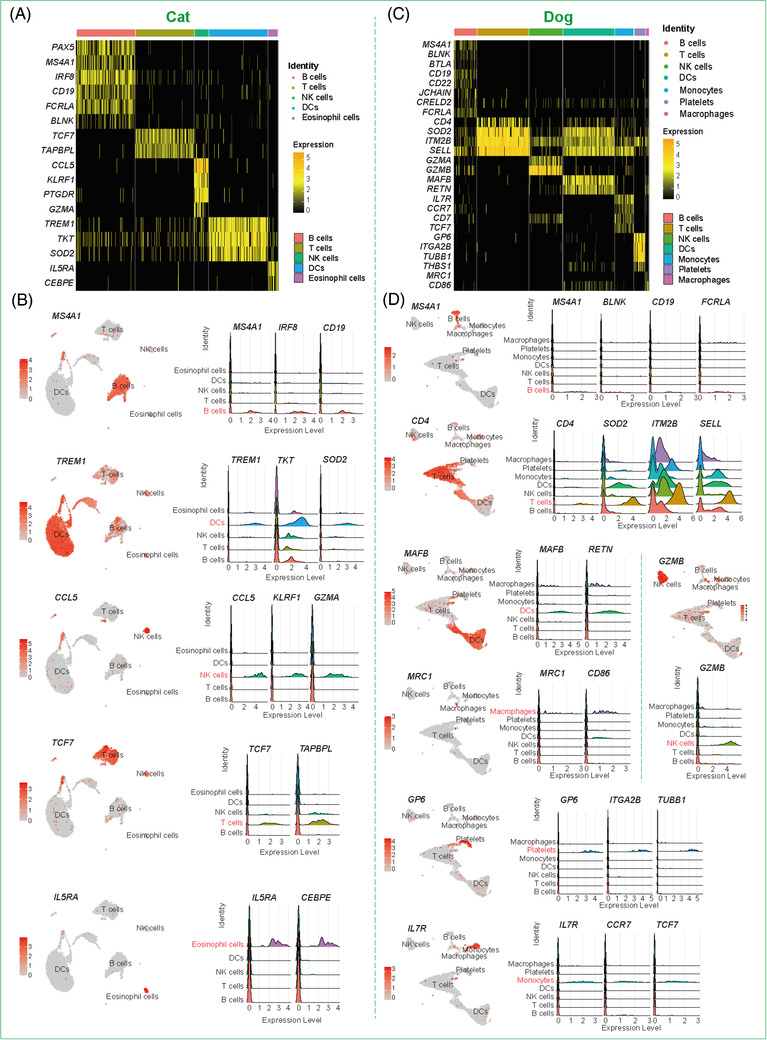
FIGURE 2.

The cellular heterogeneity and compositions of PBMCs in cat and dog. (A,C) Heatmap plots showing a series of genes expressions in various annotated cell types of cat (A) and dog (C). The colours indicated the percentage of cells that showed gene expression levels within each cell type. (B,D) Feature plots and ridge plots showing the gene expression pattern of cat (B) and dog (D) respectively in different cell types
