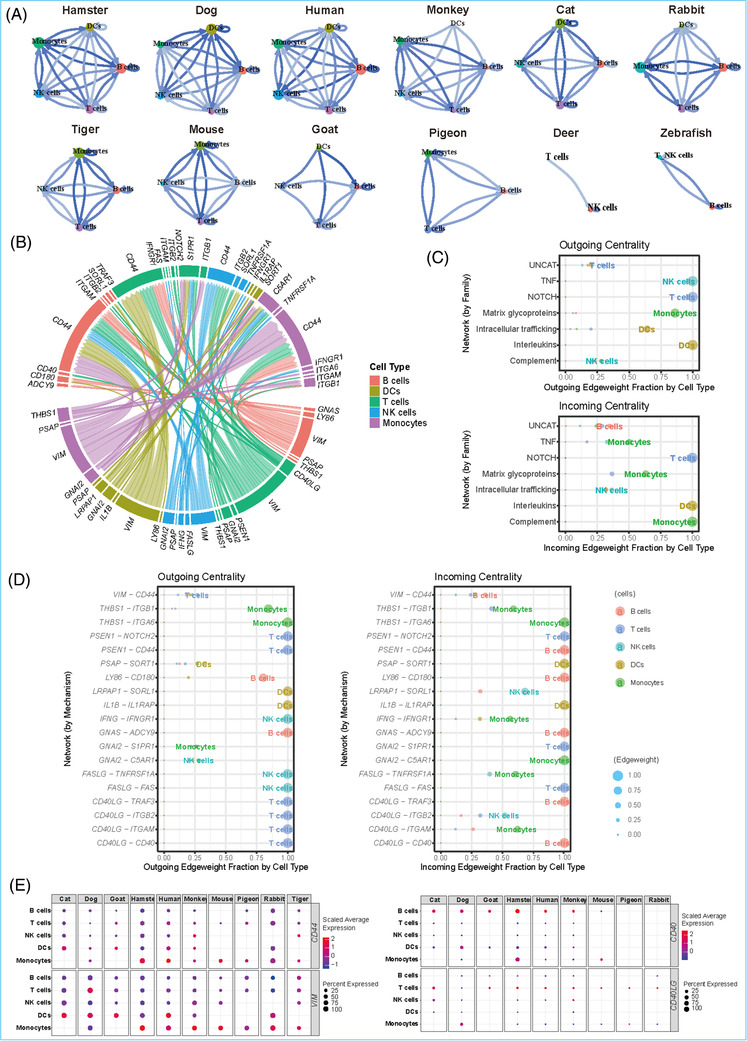
FIGURE 3.

Cross species conserved PBMCs cellular connectomes. (A) Communication network of receptor–ligand pairs between five immune cell types including B cells, T cells, NK cells, DCs, and monocytes. Cell types were represented by coloured node, of which the size was proportional to the sum of receptor–ligand pairs between this node and all other nodes. The edge colour was proportional to the number of receptor–ligand pairs between two connected nodes. (B) Circos plot of cross species conserved connectome. Receptors and ligands were displayed near the upper and lower half circle respectively. (C) Centrality analysis of the conserved connectomes grouped by modes (signalling families). In the centrality plot, the outgoing means sending and incoming means receiving, which refers to quantitative metrics of how ‘connected’ a given edge is to other edge. (D) Centrality analysis of the conserved connectomes grouped by mechanism (ligand–receptor pair). (E) Dot plots showing the co‐expression of two ligand–receptor gene pairs (VIM–CD44, CD40LG–CD40) in five immune cells of indicated species
