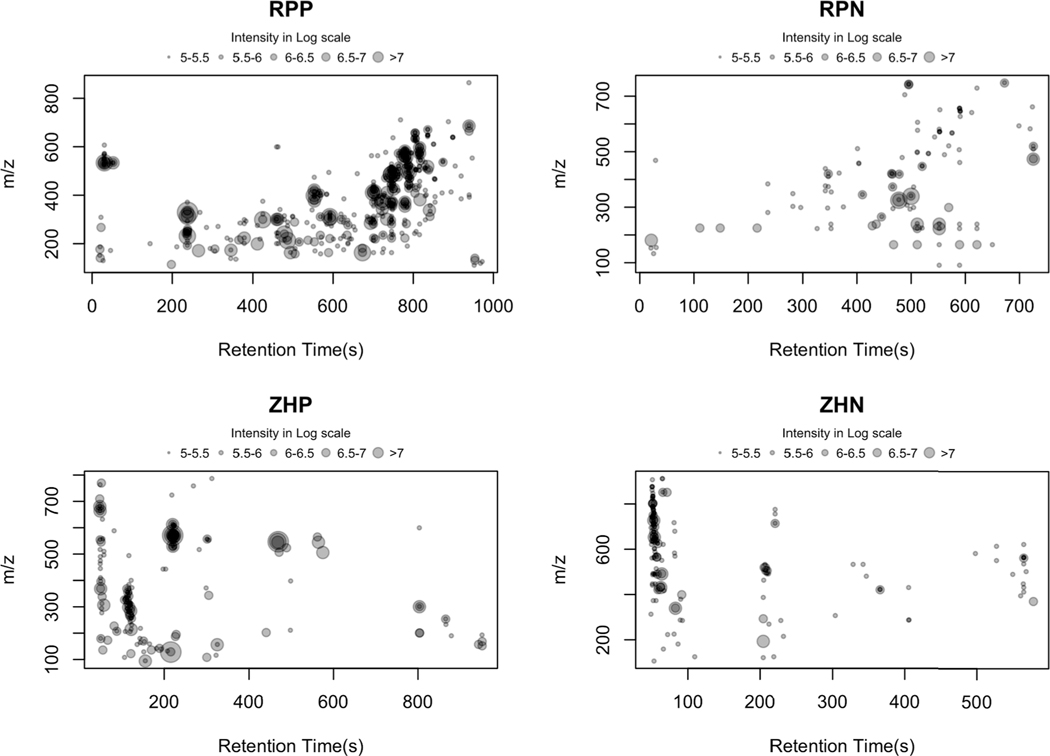
Fig. 1. Bubble plots showing peaks and their relative abundances measured in each of four analytical modes: RPP, RPN, ZHP, and ZHN.
A broad range of small and larger molecules and a range of lipophilicity can be observed in the tooth exposome. The broad distribution of peaks across the RP modes, particularly for RPP, suggests better retention on the column.

