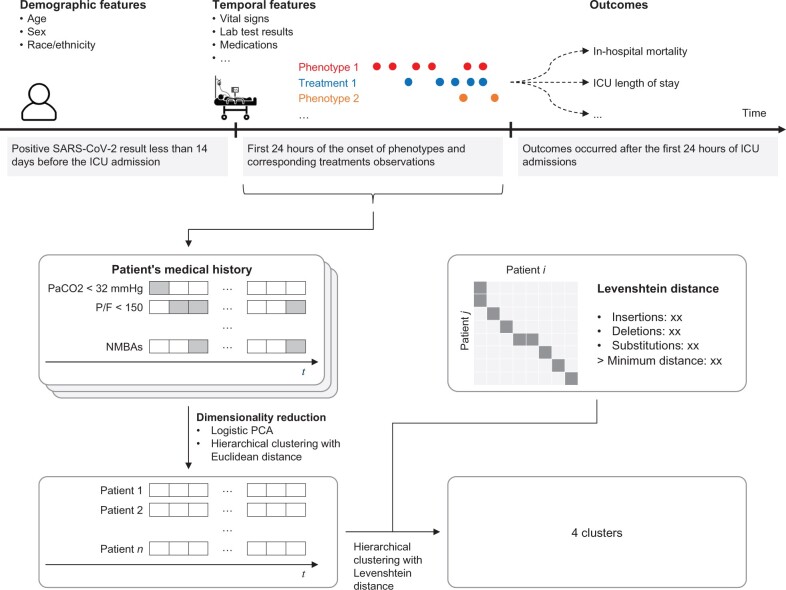
Figure 1.
Study flow diagram. Both demographic features and those expected to evolve over time were used to identify subphenotypes. Outcomes were analyzed by subphenotype. Subphenotypes were derived using the agglomerative hierarchical clustering method with Levenshtein distance and Ward’s minimum variance linkage.

