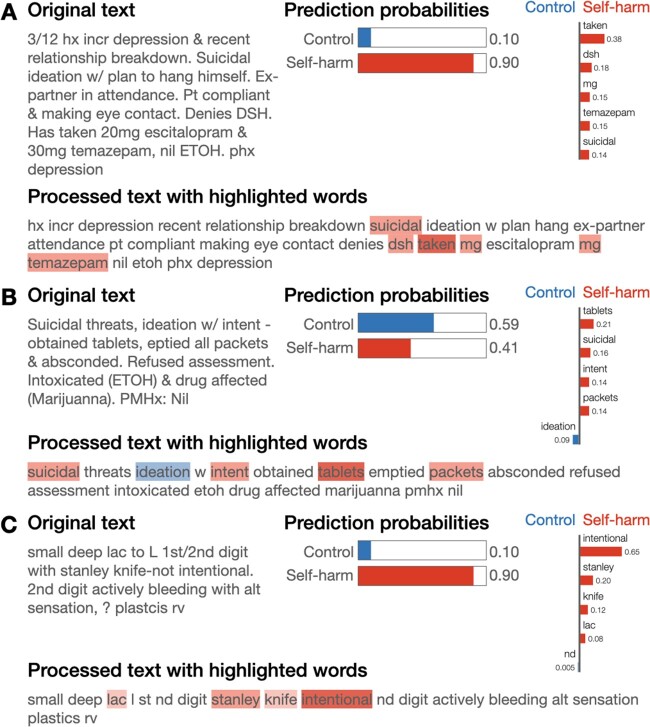
Figure 6.
Illustration of triage notes misclassified as SH (false positives). (A, B) 40% of triage notes misclassified as SH were in fact annotated as SI. (C) An example of a triage note negative for both SI and SH but misclassified as SH. The bars on the left show the predicted probability of each class. Horizontal bar plot provides the weights of 5 most important features. On the bottom, these words are highlighted in the text.

