
Figure 4.
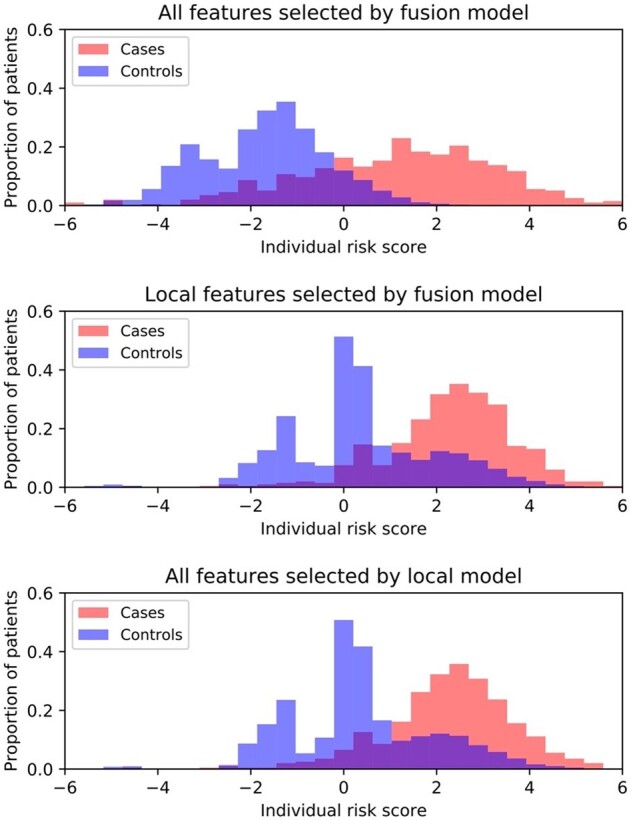
Distributions of individual suicide risk score by different models. X-axis indicates the individual risk score, which was calculated as the cumulation of coefficients of individual predictors associated with the patient. Y-axis denotes the proportion of patients (cases or controls).