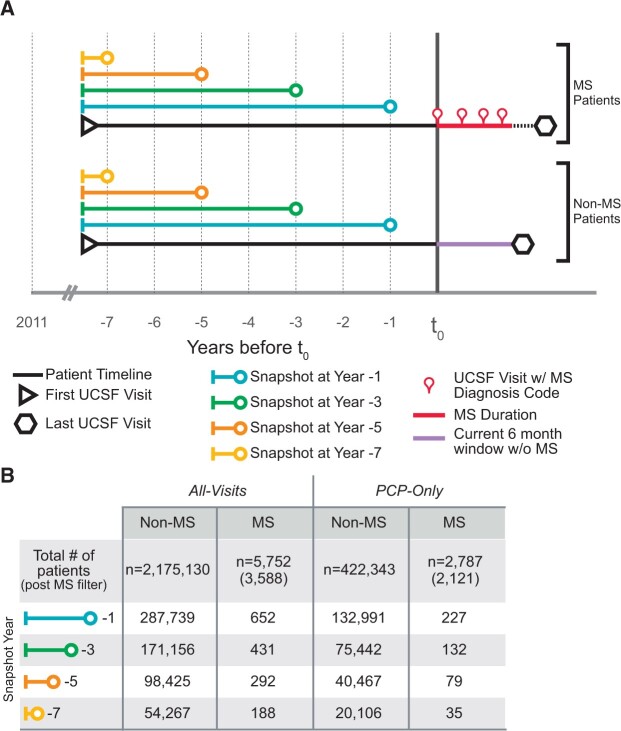
Figure 1.
Patient timeline aligning and filtering. (A) Timepoint 0 (t0) is the point of alignment for the multiple sclerosis (MS) and non-MS timelines. For MS patients, t0 was the first visit in which a patient received a diagnosis code for MS. The duration of time a patient has been diagnosed with MS is represented by a red line between the first and last visits with an MS diagnosis code. For Non-MS patients, t0 was set to 6 months (purple line) prior to their most recent visit (hexagon). Left of t0 are the patient snapshots that encompass all of the information (electronic health record data) a doctor has on a patient up to a given point of time. The snapshot at year −1 (blue line) contains all data between the first visit (triangle) and −1 year from t0. The remaining snapshots (years −3, −5, and −7) become smaller as their endpoints move farther from t0. (B) Two patient encounter groups were followed throughout the workflow: All-Visit (left) and Primary Care Physician only (PCP-Only) (right). The All-Visit analysis uses all possible encounters at UCSF, whereas the PCP-Only analysis only includes patient encounters at primary (or emergency) care visits. The number of MS or non-MS patients at each year goes from t0 (top) to −7 years (bottom) is shown.

