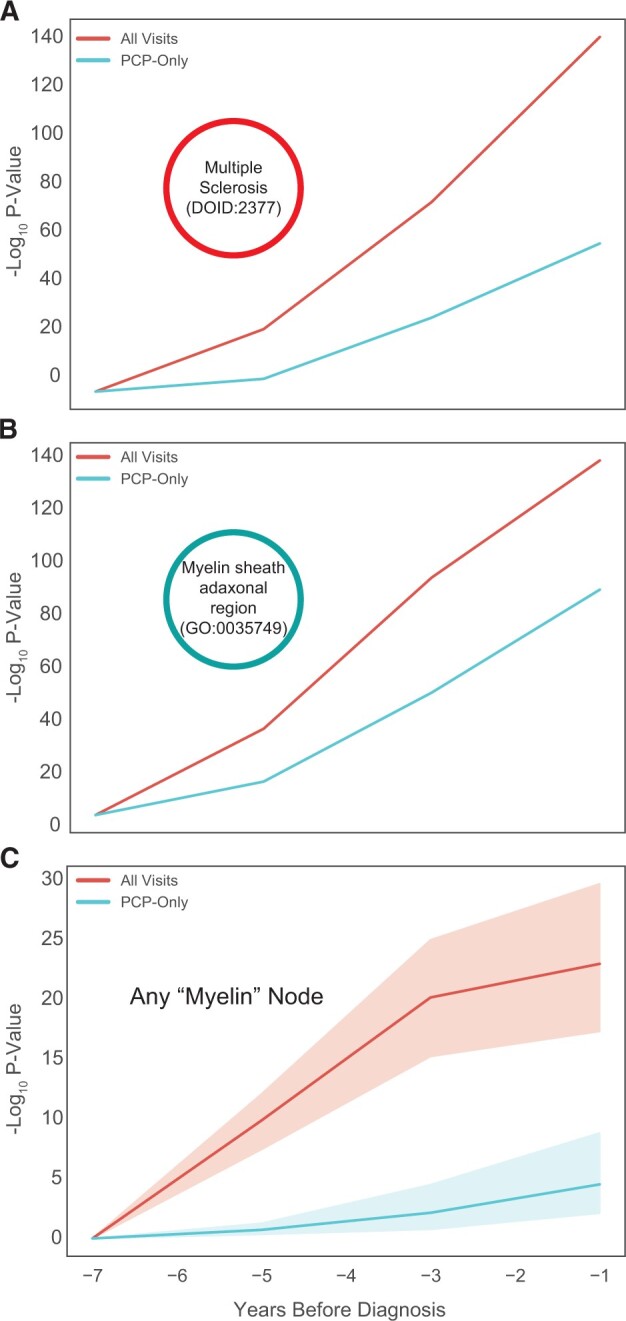
Figure 3.

Multiple sclerosis (MS) biology nodes become more significant with time to diagnosis. (A–C) For each node, the t test was used to compare the distribution of ranks between the MS and non-MS patients. Here the −log10 P-value from the t test is plotted against time to MS diagnosis (or lack thereof) for the (A) MS node (DOID:2377), (B) Myelin sheath adaxonal region (GO:0035749), and (C) group of nodes with “myelin” in the name.
