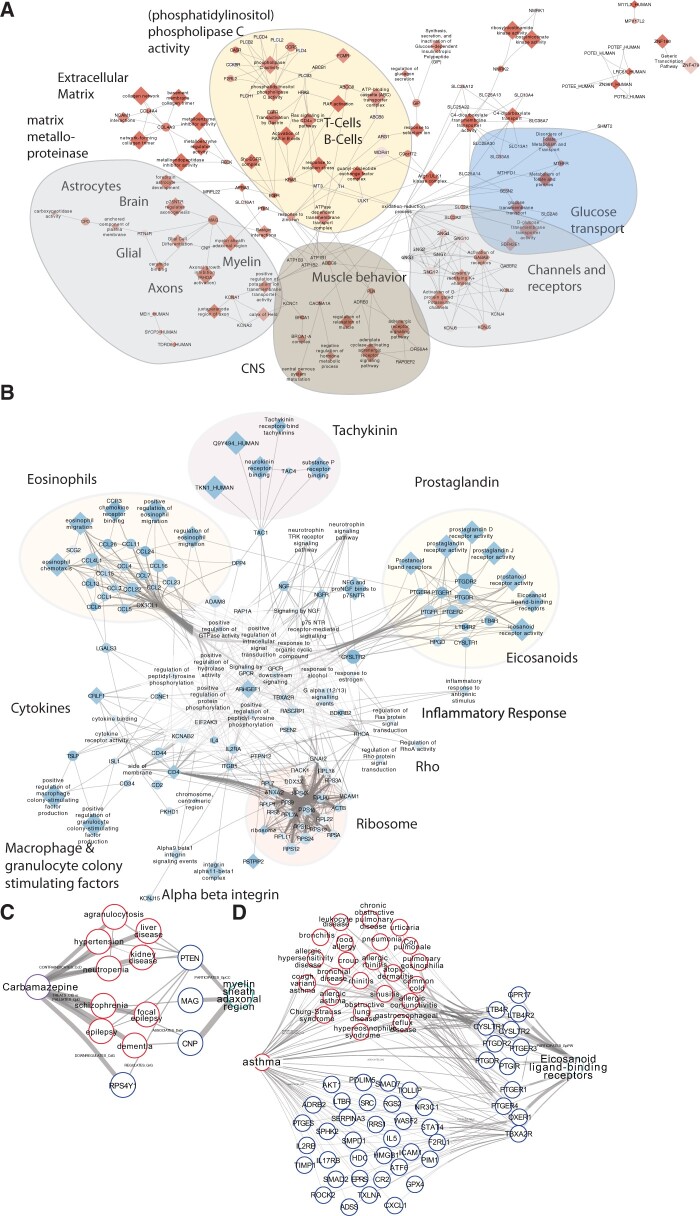
Figure 5.
Th1/Th2 balance and neurological nodes drive biological increase in AUC. (A, B) Networks of significant biological nodes for random forest classifier. Red nodes were higher ranked in the MS population (A), whereas blue nodes were higher ranked higher in the non-multiple sclerosis (MS) population (B) (color gradient based on t-statistic). The shape (diamond or oval) of the node denotes whether or not the node is in the top 20 of a given node type. If it is an oval, it must connect to ≥ 2 nodes in the top 20. Highlighted in the network are some of the nodes that correspond to Th1/Th2 balance or neurology. (C) Illustration of how a prescription for carbamazepine can send information to the Myelin sheath adaxonal region node (GO:0007404, GO:0043360; replaced by: GO:0010001). (D) Depiction of how asthma (a Th2-mediated disease that is more prevalent in the non-MS UCSF population) pushes information downstream to the Eicosanoid ligand-binding receptors node (Reactome R-HSA-391903).

