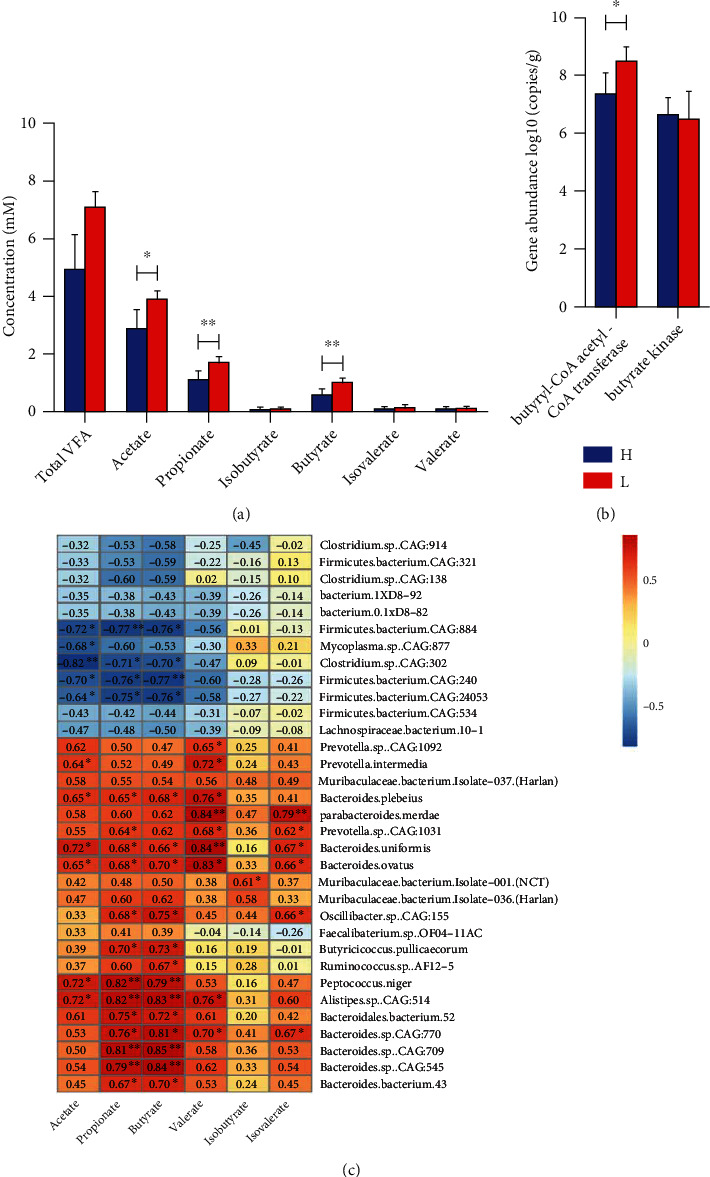
Figure 7.

The association between colonic SCFA levels and colonic microbiome in the high- and low-fat pigs. The colon content samples were collected from 5 high-fat and 5 low-fat pigs at 250 days old for the determination of SCFA content, DNA isolation, and metagenome sequencing. (a) Concentrations of SCFAs in the colons of the two groups were examined by GC. Data are expressed as mean ± SD (n = 5) and analyzed by the unpaired two-tailed Students' t-test. (b) The gene abundance of the butyrate-producing genes in the colon of the high- and low-fat groups. Data was expressed as log10 gene copies of total DNA/g colon content. (c) The Spearman correlation between the 33 differentially abundant species and SCFAs in the colon of Jinhua pigs. The X-axis shows SCFAs, whereas the Y-axis shows bacteria species. The chart's various colors and numbers reflect the correlation coefficient between the SCFA and bacteria species indicated. H: the high-fat pigs; L: the low-fat pigs. ∗P < 0.05 and ∗∗P < 0.01.
